How to Track Client Progress as a Personal Trainer: The 5-Metric Dashboard That Actually Works

Why Most Personal Trainer Client Trackers Fail
Two trainers. Same certification. Same city. Very different outcomes.
The first tracks only bodyweight. When a client's scale stalls for three weeks -- even while lifts climb and waist measurements drop -- there is no data to reframe the conversation. The client cancels.
The second tracks everything: 20 columns in a spreadsheet, wearable screenshots pasted into notes, color-coded tabs for macros. But she reviews none of it on a regular schedule. When a client asks "am I making progress?", the answer takes 15 minutes to piece together. She caps out at 18 clients before admin work consumes every open hour.
Both trainers have a tracking problem, but it is not the problem they think. The issue is not effort or intent -- it is system design. Most personal trainer client tracking setups are either incomplete (missing the signals that explain stalls and predict churn) or unactionable (collecting data that never reaches a coaching decision).
When we started building FitFlow, the first 50 trainers we interviewed described this exact gap. One trainer in Austin tracked 14 metrics per client and still could not answer "is this working?" in under ten minutes. Another had stopped tracking entirely after her spreadsheet grew to 47 tabs. The problem was never effort -- it was signal-to-noise ratio.
This guide covers the five metrics that research and coaching practice connect to client results, retention, and training readiness. You will get a goal-based dashboard framework that weights those metrics differently for fat-loss, muscle-gain, and general-health clients. You will see exactly what to collect manually versus what to automate. And you will walk away with decision rules -- specific thresholds that tell you when to progress, hold, deload, or refer out.
The timing matters. The American College of Sports Medicine ranks wearable technology as the #1 fitness trend for 2026 -- for the fifth consecutive year. Nearly half of U.S. adults now own a fitness tracker or smartwatch. Fitness tracker spending grew 88% year-over-year in the first seven months of 2025, driven largely by smart rings and advanced biosensors (Circana, 2025). The data is already flowing from your clients' wrists. The question is whether you have a system to receive it and act on it.
Download the Free Client Progress Dashboard Template
Why Progress Tracking Is a Coaching System, Not Admin
Tracking is not paperwork. It is the feedback loop that makes programming decisions defensible and coaching conversations productive.
Without data, coaches adjust programs based on intuition alone. Intuition works when you have five clients and see each of them three times per week. It breaks down at 20. At 30, it is functionally impossible to remember which client had a rough sleep week, whose volume has plateaued for a month, or who is quietly dropping from four sessions per week to two.
Data changes three things at the same time:
Programming decisions become evidence-based. "I increased your deadlift volume because your recovery scores have been strong and your RPE trended down at the same load" is a different conversation than "let's try adding a set."
Retention conversations get easier. "Here is your strength trend over 12 weeks" is a retention argument no single session can match. Clients who can see quantified progress are more likely to stay. Perceived stagnation -- even when real physical gains exist -- is a leading cause of early churn.
Referrals become objective. When a client's data flags clinical-edge issues (chronic sleep deprivation, disordered eating patterns), a trainer with data can make the referral conversation non-stigmatizing: "I am seeing consistently low HRV and your sleep has averaged 4.2 hours over three weeks. I want to connect you with the right resource."
We have watched this play out in practice dozens of times. A trainer who relies on gut feel often second-guesses a deload or avoids the referral conversation altogether. The same trainer, looking at three weeks of declining HRV on a screen, makes the call with confidence -- and the client trusts it because the data is right there between them.
For a deeper look at how data-informed decisions feed into programming at scale, see the evidence-based program design framework.
Visible Progress Increases Motivation and Retention
Recent wearable technology reviews confirm that data visibility supports physical-activity adherence and engagement. When clients receive structured progress feedback -- not just a number, but a trend in context -- they stay longer and train more consistently.
This is not about gamification or badges. It is about answering the question every client asks internally each month: "Is this working?"
What Changes in 2026
The wearable data landscape has shifted in meaningful ways:
ACSM's 2026 Worldwide Fitness Trends survey places wearable technology at #1 and mobile exercise apps at #4. This is the ninth time wearables have held the top position in the survey's 20-year history -- more than any other trend (ACSM, 2026).
A 2025 validation study across 536 nights compared five consumer wearables (Garmin Fenix 6, Oura Gen 3, Oura Gen 4, Polar Grit X Pro, WHOOP 4.0) against ECG-grade measurements. Top devices achieved concordance correlation coefficients of 0.97-0.99 for HRV -- meaning the best consumer wearable data is now reliable enough for coaching decisions (Dial et al., 2025, Physiological Reports).
Garmin Health and Oura are feeding readiness, sleep, and HRV data directly into gym operator and coaching platforms.
The practical implication: the data is already flowing from clients' wrists. Trainers who do not have a personal trainer client tracker to receive and act on that data are leaving coaching quality on the table.
For a complete overview of how these tools fit into a broader technology strategy, see the fitness technology professionals guide.
The 5 Metrics That Matter Most
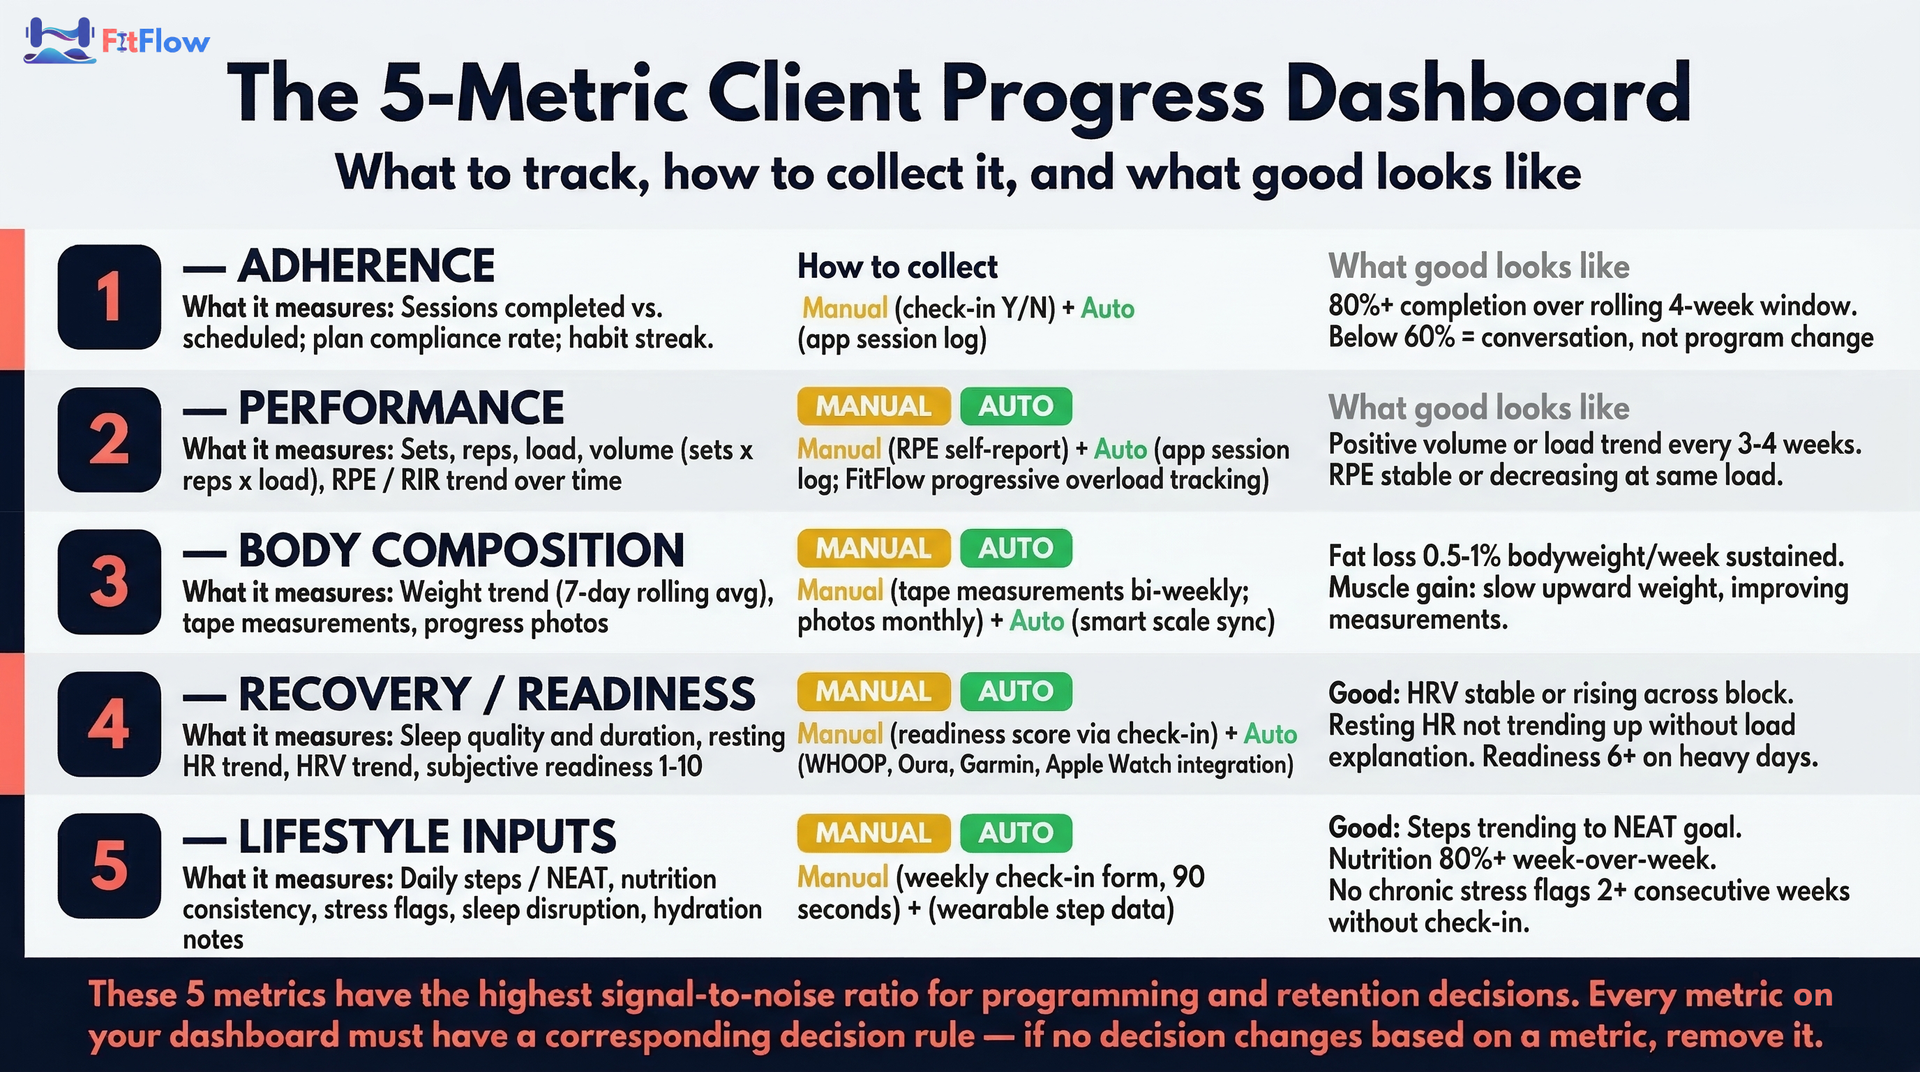
What metrics should personal trainers track? Personal trainers should track five core metrics: adherence (session completion rate), performance (volume and load progression), body composition (weight trend and measurements), recovery and readiness (HRV, sleep quality, subjective energy), and lifestyle inputs (steps, nutrition consistency, stress flags). These five metrics appear across every client goal and have the highest signal-to-noise ratio for programming and retention decisions.
These are not the only metrics that exist. They are the five that predict whether a client is progressing, recovering, and likely to stay.
1. Adherence
What it measures: Sessions completed versus sessions scheduled (completion rate), plan compliance (did the client do what was prescribed, not just something), and habit streak data if habits are assigned.
Why it is the top metric: Adherence is the leading predictor of results. A client who completes 80% of sessions over 12 weeks will outperform a client on a theoretically superior program with 50% completion -- every time.
How to collect: Check-in form (completed Y/N), app session log, client self-report (weekly).
What good looks like: 80%+ completion rate over a rolling 4-week window. Below 60% triggers a conversation before a program change.
2. Performance
What it measures: Sets, reps, load (weight used), total volume (sets x reps x load), and RPE (Rate of Perceived Exertion) or RIR (Reps in Reserve) trend over time.
Why it matters: Performance data answers "is this program producing adaptation?" A client who is not progressing on any measure in 4+ weeks needs a programming decision, not just encouragement.
How to collect: Session log (manual or app-based). Progressive overload trend tracking is automatic in platforms like FitFlow and similar coaching software.
What good looks like: Positive volume or load trend at least every 3-4 weeks. RPE should decrease or load should increase at the same RPE.
3. Body Composition and Body Measurements
Body composition tracking covers weight trend (rolling 7-day average, not single-day readings), tape measurements (waist, hip, chest, arms, legs), and progress photos. How much weight this metric carries on your dashboard depends entirely on the client's goal -- it is primary for fat-loss clients but tertiary for performance and general-health clients.
Collect weekly weigh-ins under the same conditions (morning, pre-food), bi-weekly tape measurements, and monthly progress photos. For fat-loss clients, a sustained rate of 0.5-1% bodyweight loss per week signals healthy progress. For muscle-gain clients, look for a slow upward weight trend alongside stable or improving tape measurements and performance numbers. Single-day weigh-ins without context are worse than no data at all -- they create false urgency.
4. Recovery and Readiness
What it measures: Sleep quality (duration + quality score), resting heart rate trend, HRV (heart rate variability) trend, and subjective readiness (1-10 self-report).
Why it matters: Recovery data is the early-warning system for overtraining, life stress, and illness. A 2026 narrative review in Sensors (MDPI) confirms that HRV measured via consumer wearables is a validated marker of recovery and stress response in coached populations (Sensors, Vol. 26, No. 1, 2026).
How to collect: Wearable integration (WHOOP, Oura, Garmin, Apple Watch) for objective data. Weekly check-in question for subjective readiness.
What good looks like: HRV trend stable or rising over a training block. Resting HR not trending upward without a training load explanation. Subjective readiness 6+ on heavy training days.
5. Lifestyle Inputs
Lifestyle inputs are the context layer that explains everything else on the dashboard. This metric covers daily step count and daily movement outside training, nutrition consistency (adherence to stated plan, not macro perfection), stress flags (sleep disruption, major life events), and hydration notes.
Here is why this metric matters more than most trainers realize: a client who has slept 5 hours for a week and moved 3,000 steps per day does not have a programming problem. Without lifestyle data, a coach might change the program when the real fix is a conversation about sleep hygiene or work stress. Wearable step data flows in automatically; pair it with a weekly check-in form covering 3-4 lifestyle questions (takes the client 90 seconds). You are looking for steps trending toward the client's stated daily movement goal, nutrition consistency at 80%+ week-over-week, and no chronic stress flags persisting for 2+ consecutive weeks without a check-in conversation.
Match the Dashboard to the Client's Goal
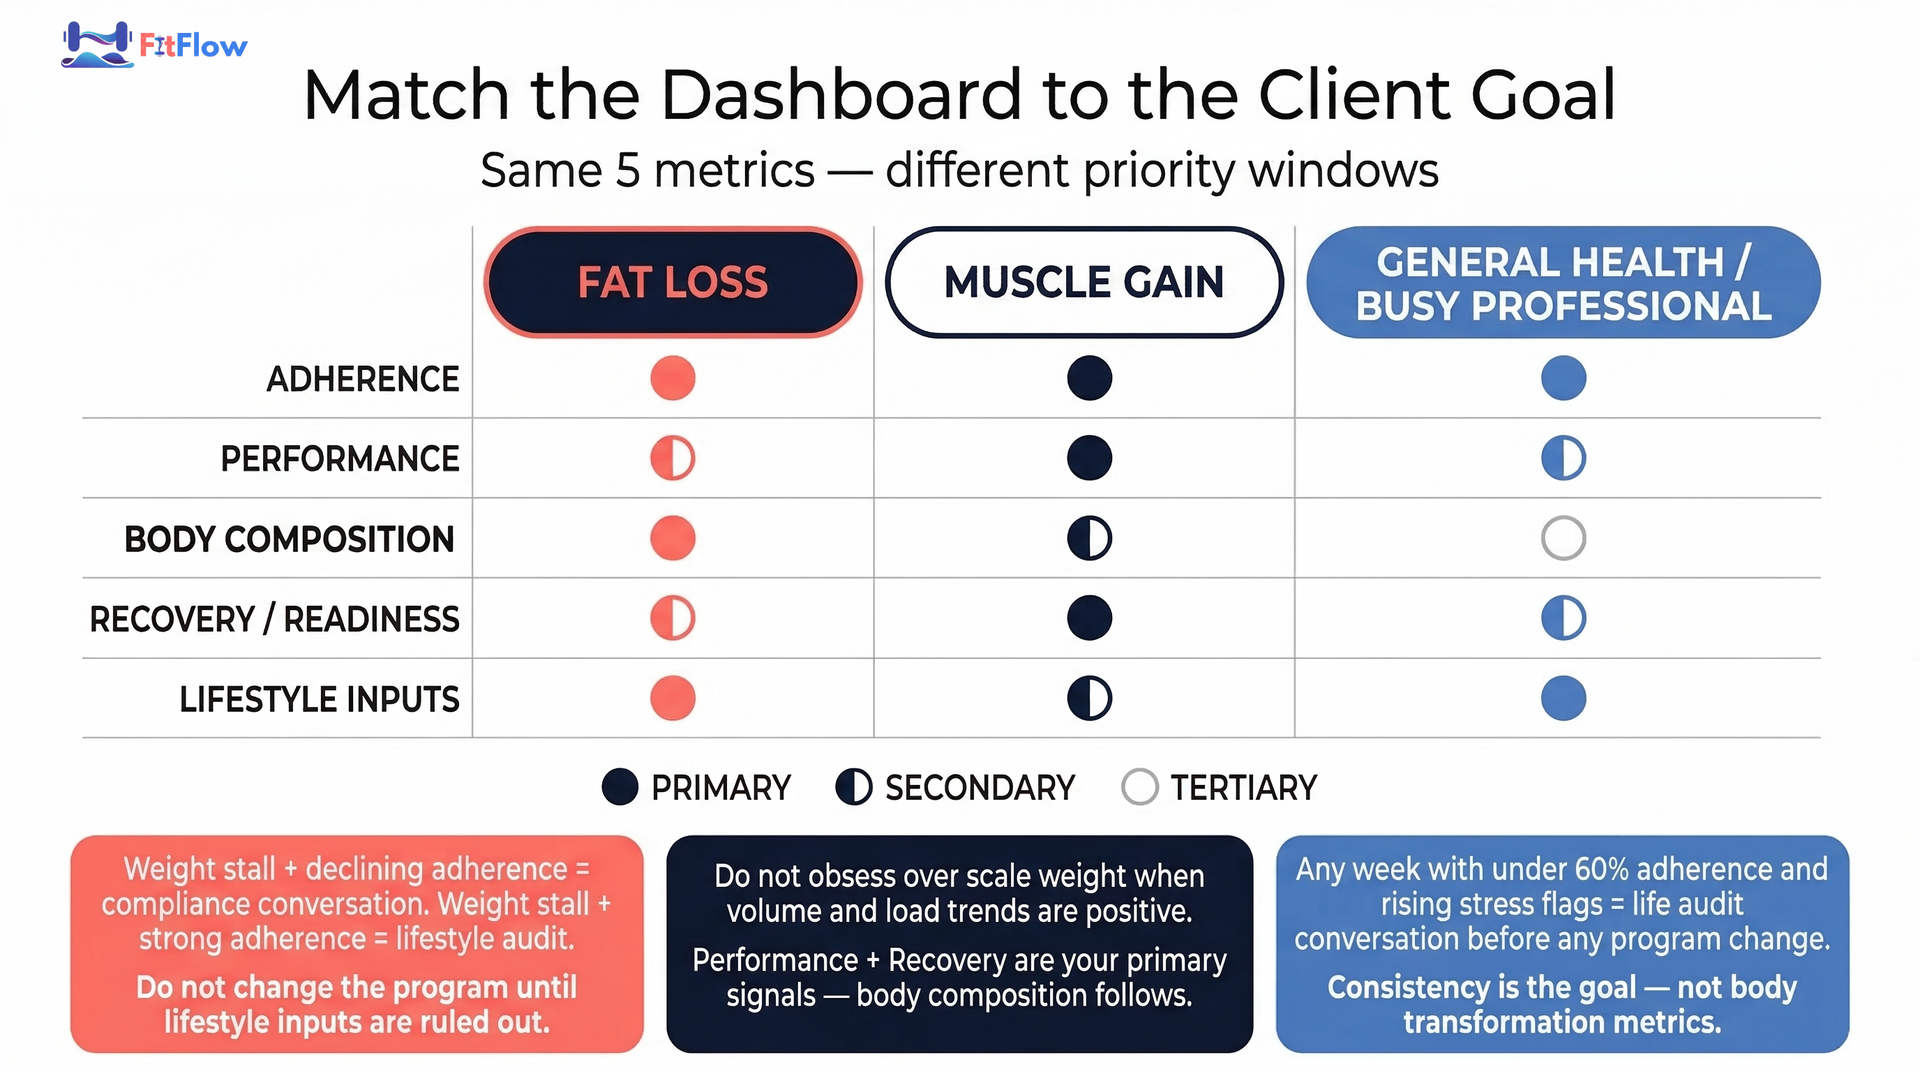
What is the best way to measure fitness progress? The best way depends on the client's primary goal. All five metrics belong on the dashboard, but the priority weighting changes. Fat-loss clients need adherence, body composition, and lifestyle inputs as primary signals. Muscle-gain clients need performance and recovery front and center. General-health clients should focus on adherence and lifestyle consistency above all else.
Not all five metrics carry equal weight for every client. The dashboard does not change -- the priorities do.
Metric | Fat Loss Clients | Muscle Gain Clients | General Health / Busy Professionals |
|---|---|---|---|
Adherence | Primary | Primary | Primary |
Performance | Secondary | Primary | Secondary |
Body Composition | Primary | Secondary | Tertiary |
Recovery / Readiness | Secondary | Primary | Secondary |
Lifestyle Inputs | Primary | Secondary | Primary |
Fat Loss Clients
Adherence + Body Composition + Lifestyle Inputs are primary. Performance is a secondary signal.
Key watch point: A weight stall with declining adherence signals a compliance conversation. A weight stall with strong adherence signals a programming or lifestyle audit (steps, nutrition consistency, sleep).
Common mistake: Changing the program when the data points to a lifestyle input problem. Too few steps, inconsistent nutrition, or disrupted sleep account for most fat-loss plateaus -- not exercise selection.
Muscle Gain Clients
Performance + Recovery are primary. Body composition is secondary and should not drive weekly decisions.
Key watch point: A performance plateau with good recovery scores means the program needs progression. A performance plateau with poor HRV or sleep means the issue is load management, not programming.
Common mistake: Obsessing over scale weight when volume and load trends are positive. A client gaining strength and recovering well is progressing regardless of what the scale says this week.
General Health and Busy Professionals
Adherence + Lifestyle Inputs are primary. This client's goal is consistency and health behavior, not body composition change or PR chasing.
Key watch point: Any week with less than 60% adherence and rising stress flags warrants a life audit conversation before any programming change.
Common mistake: Applying the same high-performance tracking rigor to a client whose goal is stress management and sustainable movement habits. More data is not better here -- the right data, reviewed on a set schedule, is what matters.
What to Collect Manually vs. Automatically
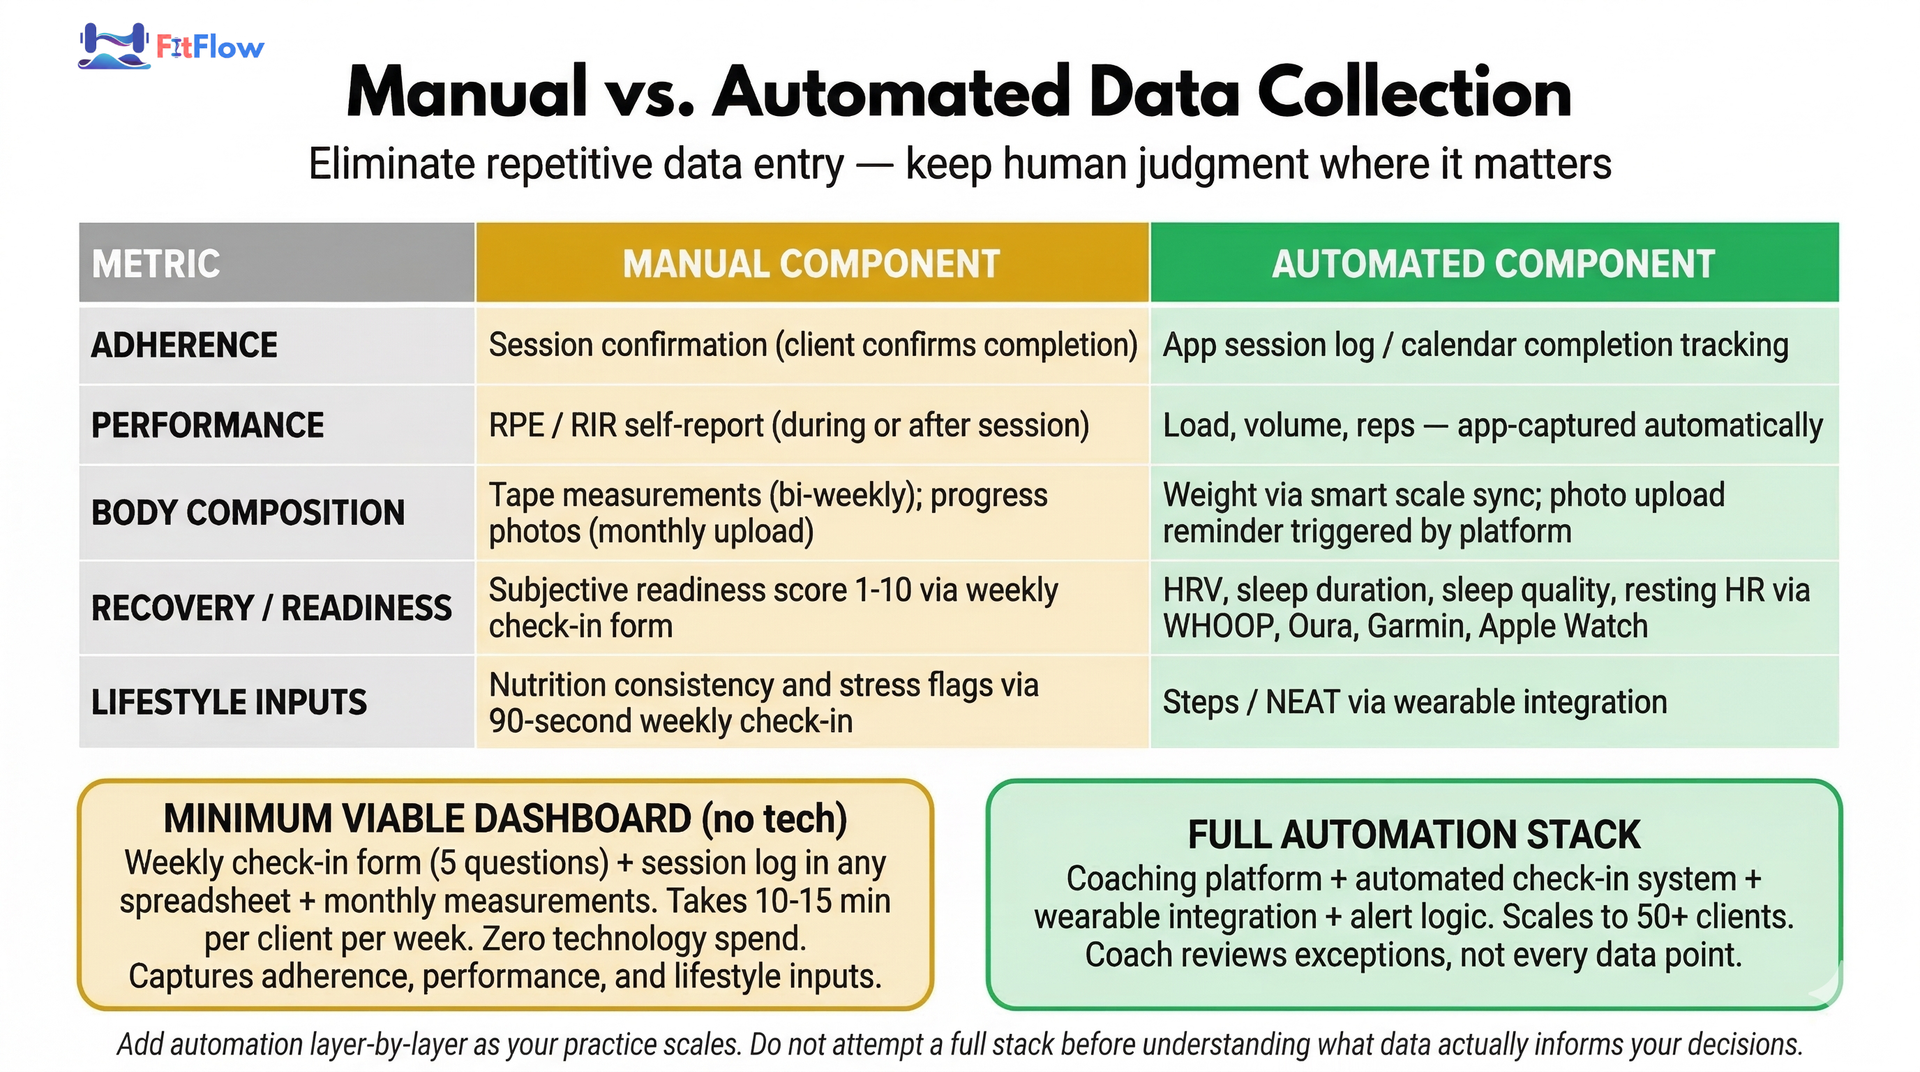
How do personal trainers track client progress? Personal trainers track progress through a combination of manual and automated methods. Manual collection covers subjective data points like RPE ratings, lifestyle flags, and coaching observations. Automated collection uses wearable integrations and coaching platform session logs to capture HRV, sleep quality, step count, workout volume, and habit streaks without additional coach effort.
The goal is not to eliminate all manual effort. It is to eliminate repetitive, low-value manual effort so coach time is spent on interpretation, not data entry.
Need a Simpler Way to Collect These Metrics Every Week?
Manual Data Collection
These data points require human judgment or client self-report:
RPE / RIR ratings -- client self-report during or after each session
Lifestyle flags -- stress, illness, major life events -- best collected via a weekly check-in form
Subjective readiness -- 1-10 self-assessment before training
Session notes -- qualitative coaching observations on technique, motivation, and engagement
Automated Data Collection
These data points can be captured without coach intervention:
Wearable data: HRV, resting HR, sleep duration and quality, step count (via WHOOP, Oura, Garmin, Apple Health integrations)
App session logs: sets, reps, load (auto-captured if the client uses a platform-integrated app)
Habit tracking streaks (platform-native)
Check-in reminders (automated weekly trigger via platform or form tool)
Manual vs. Automated by Metric
Metric | Manual Component | Automated Component |
|---|---|---|
Adherence | Session confirmation | App log / calendar completion |
Performance | RPE / RIR self-report | Load, volume, reps -- app-captured |
Body Composition | Tape measurements (bi-weekly) | Weight (smart scale sync); photos (app upload) |
Recovery / Readiness | Subjective readiness (check-in) | HRV, sleep, resting HR (wearable) |
Lifestyle Inputs | Nutrition consistency, stress flags (check-in) | Steps / NEAT (wearable) |
The Minimum Viable Dashboard
If you have no wearable-integrated clients and no coaching platform, the minimum viable system is:
Weekly check-in form -- 5 questions covering adherence, readiness, nutrition consistency, sleep quality, and stress level
Session log -- in any spreadsheet or notebook
Monthly measurements -- weight, tape measurements, and progress photos
This takes 10-15 minutes per client per week and captures adherence, performance, and lifestyle inputs with zero technology spend. As your practice scales, add automation layer-by-layer. Do not attempt a full automation stack before you understand what data actually shapes your decisions.
For guidance on choosing the right tools as you scale, see how to build your fitness tech stack step by step.
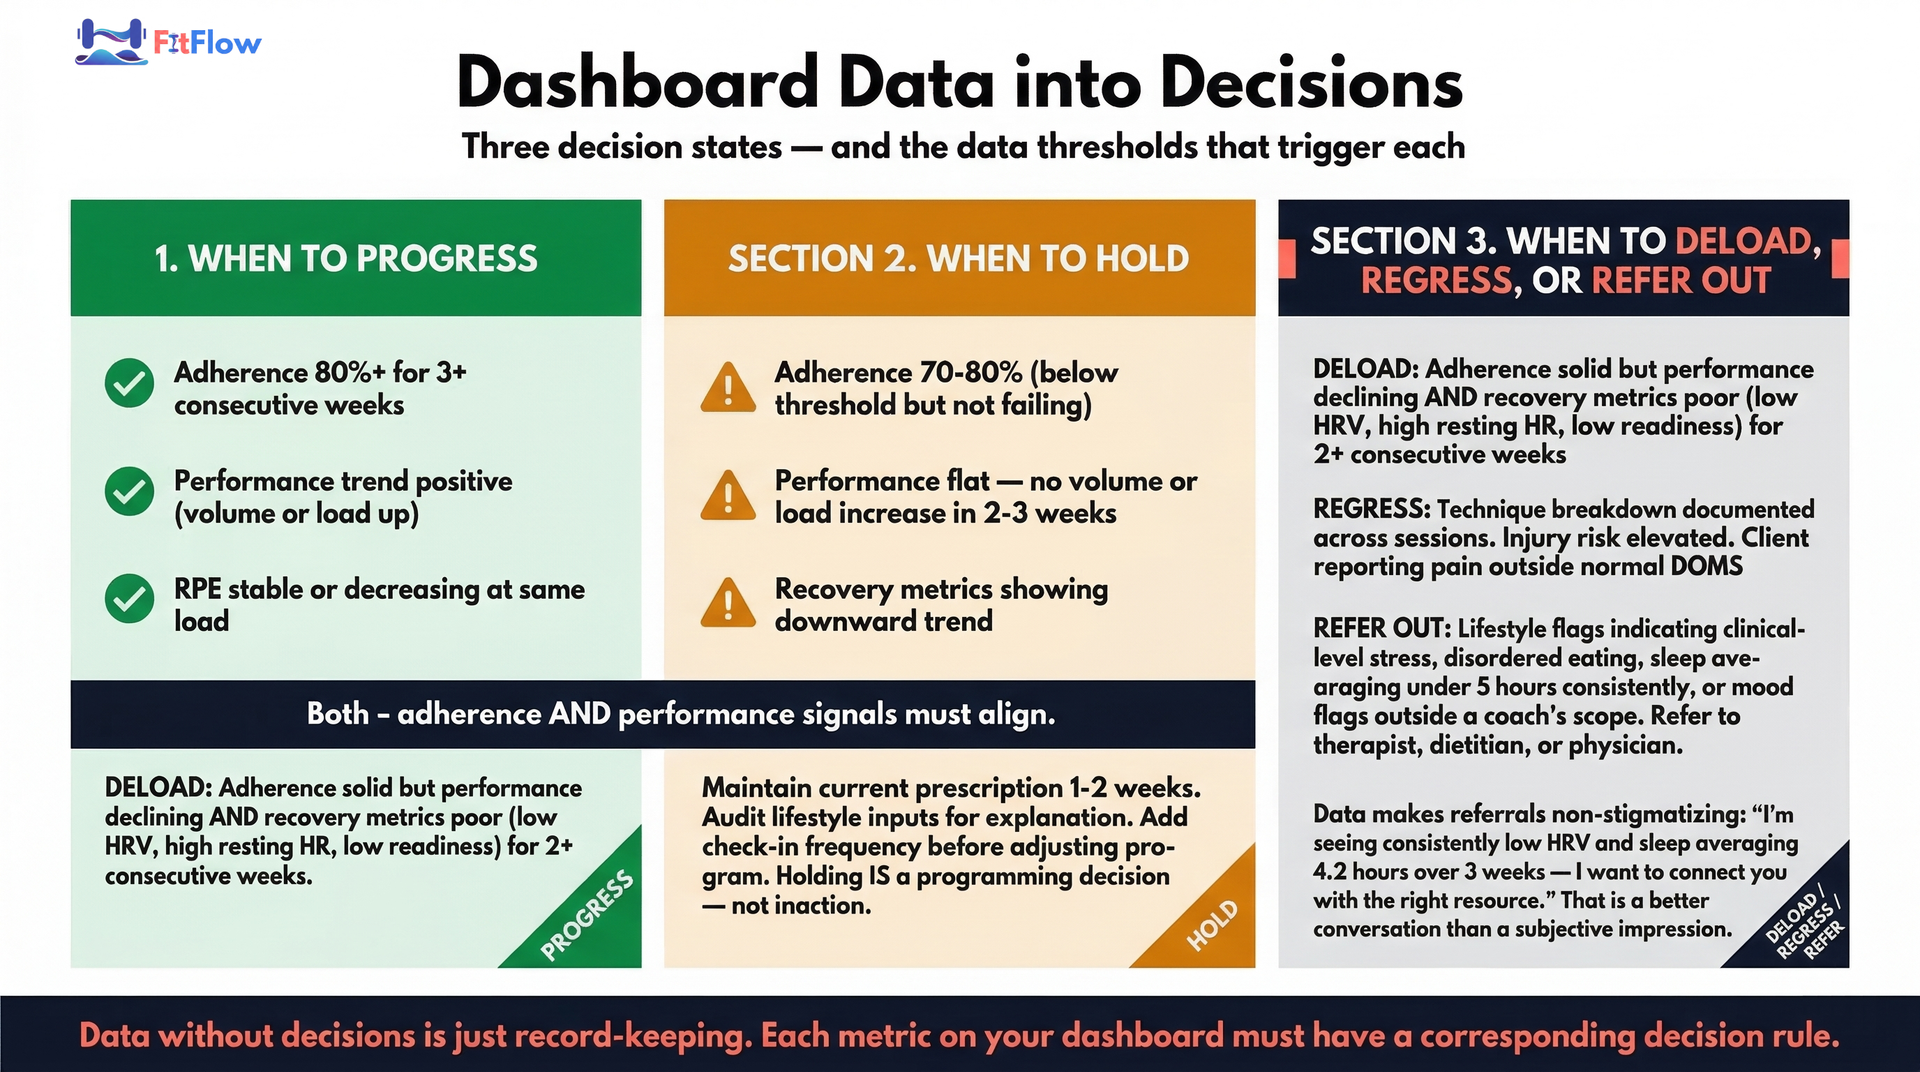
How to Turn Dashboard Data into Decisions
Data without decisions is record-keeping. This section translates the five metrics into specific coaching actions with clear thresholds.
When to Progress
All three conditions must be met:
Adherence 80%+ for 3+ consecutive weeks
Performance trend positive (volume or load increasing)
RPE stable or decreasing at the same load
Action: Add volume (one new set), increase load (2-5% upper body, 5-10% lower body), or advance exercise variation.
Do not progress on adherence or performance alone. Both signals need to align. A client who shows up consistently but whose lifts are flat may need a deload, not more volume.
When to Hold
Any of these conditions present:
Adherence 70-80%
Performance flat (no volume or load increase in 2-3 weeks)
Recovery metrics showing a downward trend
Action: Maintain current prescription for 1-2 weeks. Audit lifestyle inputs for explanation. Increase check-in frequency (a text or message) before adjusting the program.
Holding is not inaction. It is a deliberate programming decision -- one that avoids the common mistake of changing a program that is working when the issue lives in recovery or lifestyle factors.
When to Deload, Regress, or Refer Out
Deload trigger: Adherence is solid, but performance is declining AND recovery metrics are poor (low HRV, elevated resting HR, low subjective readiness) for 2+ consecutive weeks.
Regression trigger: Technique breakdown documented across sessions. Injury risk elevated. Client reporting pain outside normal DOMS.
Refer out trigger: Lifestyle flags indicating clinical-level concerns -- disordered eating patterns, sleep pathology (averaging less than 5 hours consistently), or persistent mood flags that a coach is not qualified to address. Always refer to the appropriate professional (therapist, registered dietitian, physician).
Coaches who have data can make referral conversations objective. "I am seeing consistently low HRV and your sleep scores have averaged 4.2 hours over the last three weeks -- I want to connect you with the right resource" is a far better conversation than acting on a subjective impression.
Consult a healthcare professional before starting any new exercise or nutrition program. The guidance in this article is for fitness coaching purposes and does not constitute medical advice.
For more on building systematic programming decisions into your workflow, see the evidence-based program design guide.
Review Cadence: Weekly, Monthly, Quarterly
How often should trainers review client progress? Trainers should review client progress on three tiers: a weekly asynchronous check-in (5 minutes per client), a monthly full dashboard review (15-20 minutes per client), and a quarterly reset conversation (30-45 minutes per client). This tiered approach balances thoroughness with scalability.
Review Type | Frequency | What to Review | Time Required |
|---|---|---|---|
Check-in Pulse | Weekly | Adherence, lifestyle inputs, subjective readiness -- flag any below-threshold signals | 5 min per client |
Performance Review | Monthly | Full 5-metric dashboard; progress toward goal; programming adjustment if needed | 15-20 min per client |
Quarterly Reset | Every 12-16 weeks | Goal reassessment, body composition comparison, program phase transition, retention conversation | 30-45 min per client |
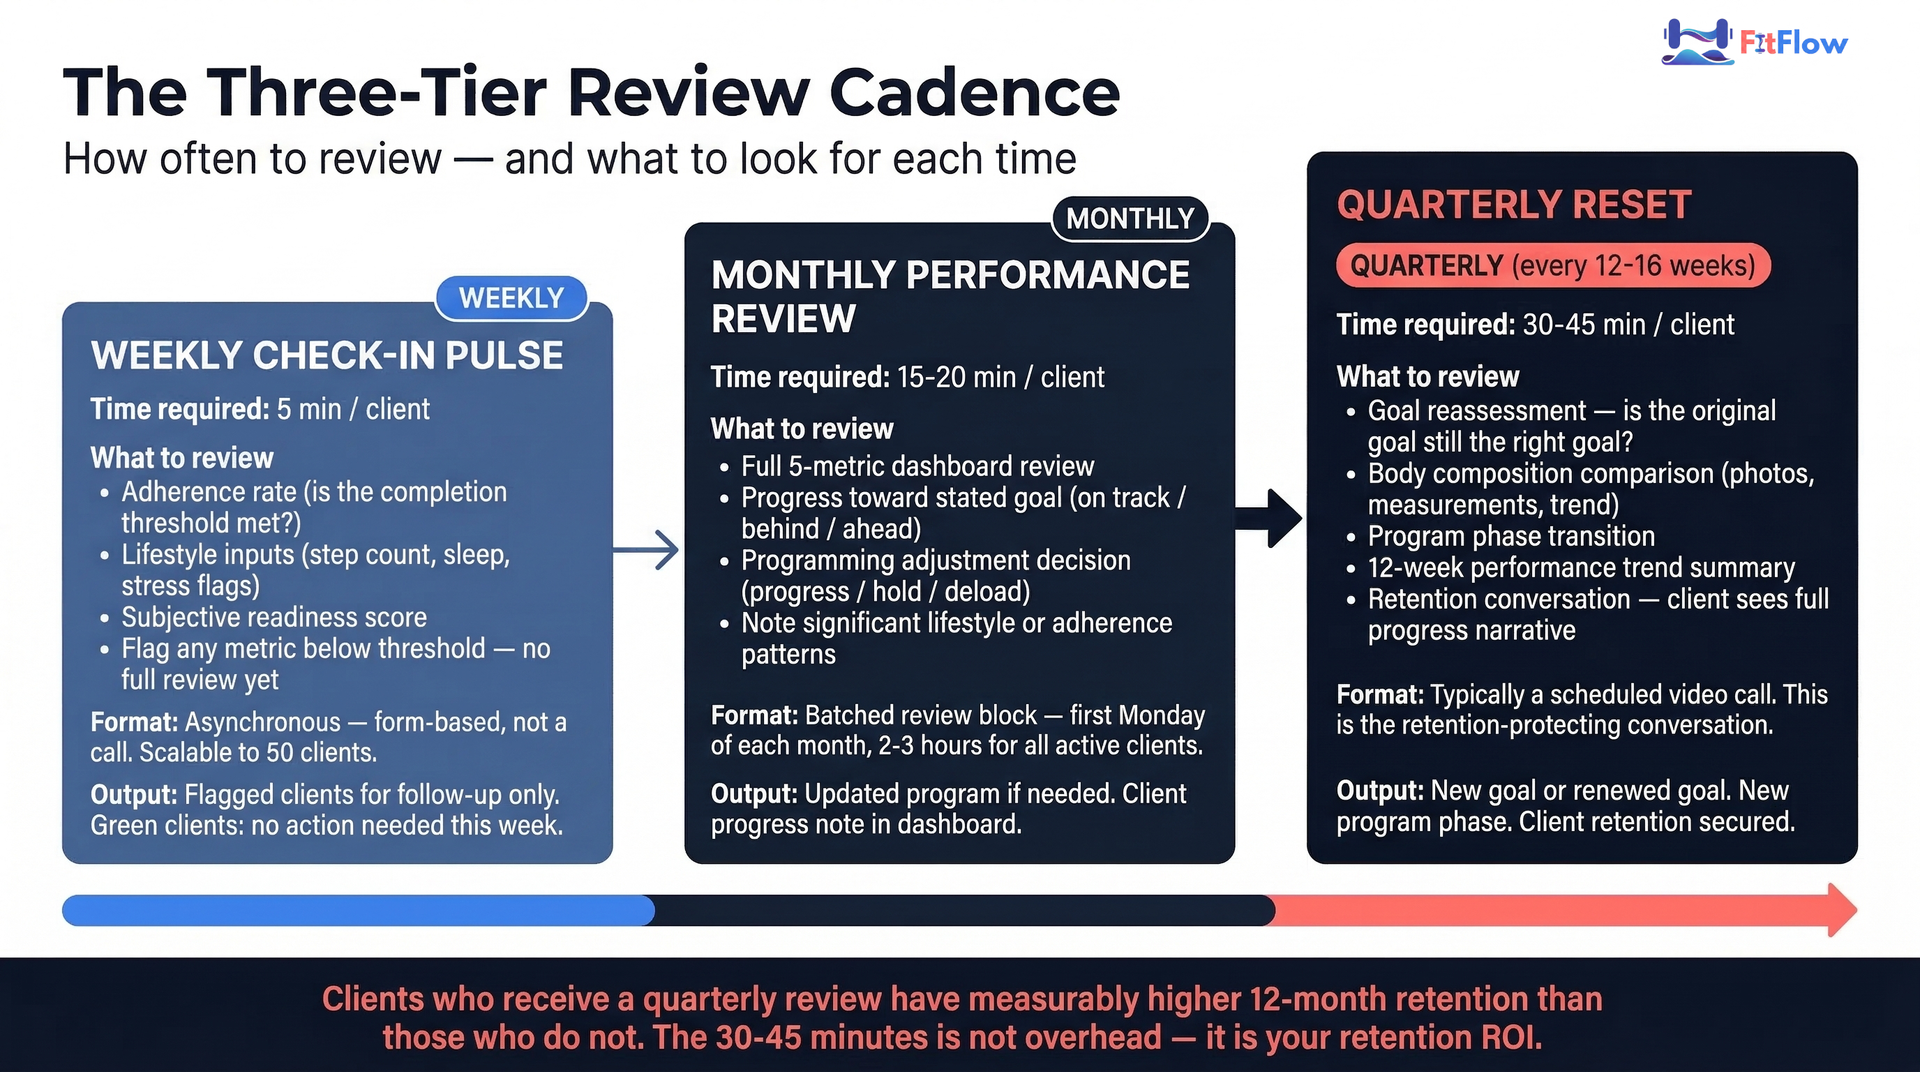
Weekly check-ins should be asynchronous (form-based, not a call) for scalability. A 5-question form takes the client 90 seconds and the coach 5 minutes to review.
Monthly reviews can be batched into a dedicated review block -- for example, the first Monday of each month, 2-3 hours for all active clients. This is where the full dashboard earns its value.
Quarterly resets are the retention-protecting conversations. Clients who receive a structured quarterly review with data-backed progress summaries have measurably higher 12-month retention than those who do not. These work best as a video call where you walk through the dashboard together. For more on structuring retention conversations, see the client retention and quarterly review framework.
Common Tracking Mistakes
Tracking weight only. The scale does not distinguish fat, muscle, water, and glycogen. Weight-only tracking is meaningless without body composition or performance context.
Reviewing data reactively. Waiting until a client complains before looking at their dashboard. Build the review cadence first; set up alert thresholds second.
Collecting data you never use. Every metric on the dashboard should have a corresponding decision rule. If no decision changes based on a metric, remove it.
Tracking the same metrics for every client goal. A fat-loss client and a performance client need different priority windows. Use the metric weight table above to match the dashboard to the goal.
Ignoring lifestyle inputs when performance stalls. The most common programming error is changing the program when the data problem is in lifestyle -- steps, sleep, and stress account for the majority of unexplained performance plateaus.
No automation, no scale. Manual data collection for 30+ clients is unsustainable. A trainer who manually collects all data is capping their practice at 15-20 clients before admin consumes every open hour.
The Automation Stack for Scaling Client Tracking
The goal of automation is not to remove the coach from the loop. It is to make sure the coach spends time on interpretation and decision-making rather than data entry and follow-up.
A complete tracking automation stack has four components:
1. Coaching Platform
A platform like FitFlow, Trainerize, TrueCoach, or Hevy Coach centralizes session logs, adherence data, and progress metrics in one coach-side dashboard. This eliminates manual spreadsheet entry for performance metrics and gives you a single view of each client's training history. For a complete overview of fitness technology categories, see the fitness technology professionals guide.
2. Automated Check-in System
A weekly check-in form triggered automatically by the platform (or via Typeform/Google Forms connected through Zapier). Clients complete it in 90 seconds. The coach reviews flagged responses only. This approach can save 20-30 minutes per client per month on manual follow-up messages.
3. Wearable Integration
Apple Health, Garmin Connect, WHOOP, and Oura API integrations push HRV, sleep, step count, and resting HR directly into the dashboard. This eliminates subjective recall for recovery metrics. A 2025 validation study across 536 nights confirms the best consumer wearables achieve correlation scores of 0.97-0.99 for HRV against ECG-grade measurements -- reliable enough for coaching decisions (Dial et al., 2025).
4. Alert Logic and Exception-Based Management
Set threshold alerts so you only get notified when a metric falls below a decision threshold:
Adherence drops below 70%
HRV trend down for 5+ consecutive days
Check-in not completed by Sunday midnight
Subjective readiness below 4 for two consecutive weeks
This shifts the coach from reviewing every data point to reviewing exceptions -- a model that scales from 10 clients to 50 without proportionally increasing admin time.
FitFlow is built to centralize workout data, check-ins, and coach-side dashboards so you do not have to piece this together across spreadsheets, forms, and messaging apps. FitFlow is our product. The methodology in this guide applies regardless of which platform you choose.
Get the Free Dashboard Template — or See How FitFlow Automates It
Download the Free Dashboard Template
This personal trainer client tracking template puts everything in this guide into a ready-to-use format:
Google Sheets version with conditional formatting for threshold alerts and built-in decision rule annotations
Notion template with linked databases for each metric category
CSV-ready export compatible with any coaching platform
The template is pre-configured for all three client goal types (fat loss, muscle gain, general health), includes the weekly check-in questions, and has the decision rules from the "When to Progress / Hold / Deload" section built in as conditional formatting and margin notes.
Get the free dashboard template -- or see how FitFlow turns these metrics into one coaching workflow.
Key Takeaways
Track five metrics, not twenty. Adherence, performance, body composition, recovery/readiness, and lifestyle inputs cover every client goal with the highest signal-to-noise ratio.
Prioritize by goal. Fat-loss clients need adherence + body comp + lifestyle. Muscle-gain clients need performance + recovery. General-health clients need adherence + lifestyle consistency.
Automate the repetitive. Wearable integrations and automated check-ins eliminate low-value manual effort. Coach time goes to interpretation, not data entry.
Build decision rules, not just dashboards. Every metric should have a threshold that triggers a specific coaching action: progress, hold, deload, or refer.
Review on three tiers. Weekly pulse checks (5 min), monthly full reviews (15-20 min), quarterly resets (30-45 min). Batch monthly reviews into a single block for efficiency.
Start with the minimum viable dashboard. A weekly 5-question check-in form plus a session log captures the core signals with zero tech spend. Scale automation as your practice grows.
Frequently Asked Questions
Comments