Building a Thriving Personal Training Business in 2026: The Complete Technology-Enabled Growth Guide

Building a Thriving Personal Training Business in 2026: The Complete Technology-Enabled Growth Guide
A Comprehensive Pillar Guide | FitFlow Business Growth Series | March 2026
Master the business side of fitness: Data-driven strategies for client acquisition, retention systems, pricing optimization, and technology leverage that separate 6-figure personal training business owners from the struggling 80%.
The bottom line: Personal trainers using integrated management platforms serve an average of 42 clients versus 18 for those using spreadsheets -- a 133% capacity increase with identical time investment. At $400/client monthly, that is the difference between $7,200 and $16,800 in monthly revenue. (These figures are aggregated from multiple fitness platform case studies, including ABC Trainerize, TrueCoach, and Exercise.com user data. Individual results vary by market, niche, and experience level.)
The personal training business landscape in 2026 represents an $11.9 billion U.S. market (IBISWorld, 2025), projected to grow steadily through 2030. Yet 80% of personal trainers leave the profession within their first year -- not due to training competency, but due to business failure.
This guide addresses the severely underserved category of fitness business operations -- the systems, technology, and data-driven strategies that separate struggling trainers from thriving business owners. While 90% of fitness content focuses on workouts and nutrition, we focus on what actually determines whether you will still be training clients in three years.
I will be honest with you: when we first started pulling this data together, the gap between what top performers do and what everyone else does was wider than we expected. It is not subtle. The trainers who make it past year one are not necessarily better coaches -- they just run a tighter ship. This guide is our attempt to close that gap.
5 Key Data-Backed Takeaways
Success Factor | Impact | Source |
|---|---|---|
Technology adoption | 133% capacity increase (42 vs. 18 clients) | Aggregated fitness platform case studies (Trainerize, TrueCoach, Exercise.com) |
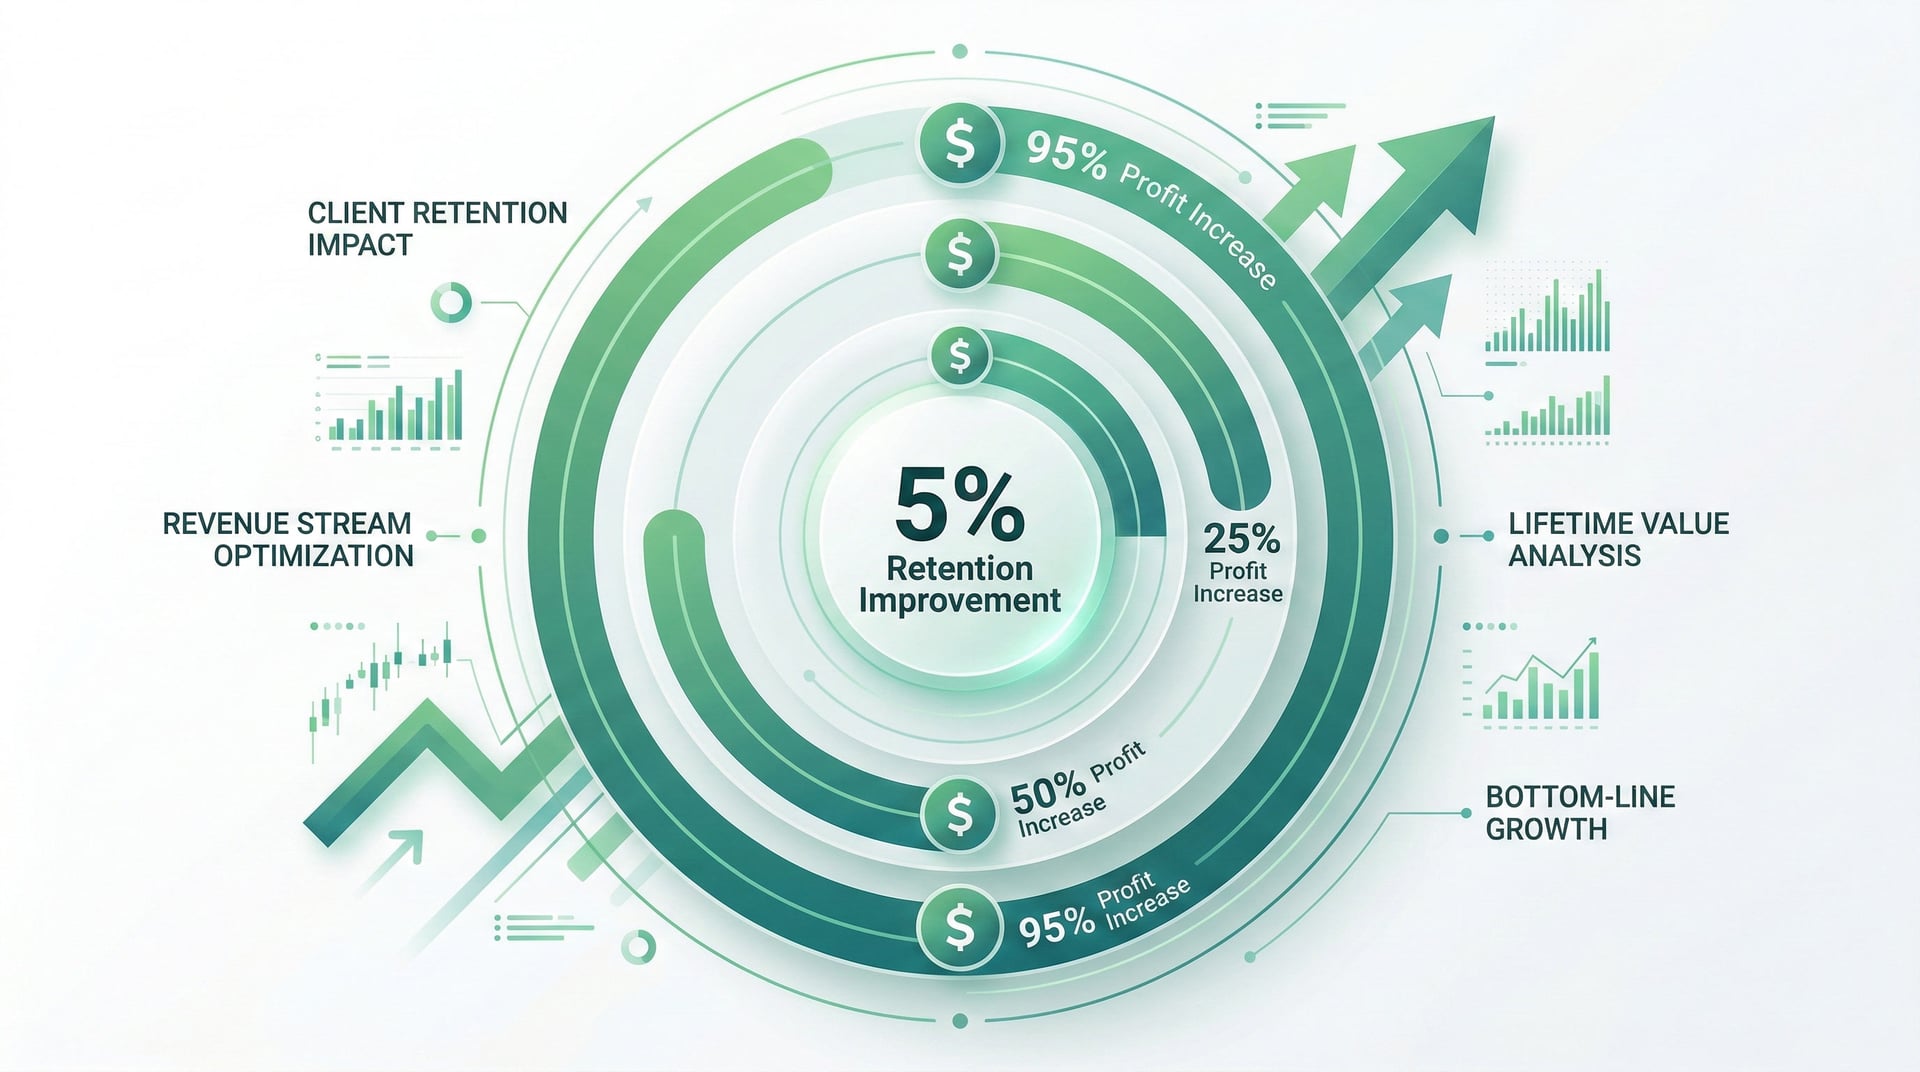
Retention focus | 5% improvement leads to 25-95% profit increase | |
Financial systems | 50-70% margins vs. 20-30% without tracking | BusinessDojo Analysis |
Hybrid delivery | 83% of trainers continue online platforms | IHRSA Industry Report |
First-year survival | Only 20% remain after 12 months | ACE Industry Survey |
What you will learn:
How to acquire your first 50 clients through proven, measurable channels
Pricing strategies that maximize revenue per client by 30-50%
Retention systems that keep clients 2x longer than industry average
Technology stack decisions that pay back in weeks, not months
Scaling pathways from solo operation to team-based business
The 2026 Fitness Business Landscape
The Evolution: How We Got Here (2015 to 2020 to 2026)
2015: The Time-for-Money Trap
The fitness industry operated on a linear equation: more hours equaled more money. A trainer's income was mathematically capped by physical endurance. If a trainer stopped working, revenue stopped immediately. The typical ceiling was 25-30 in-person clients at $50-75/hour, generating $60,000-90,000 annually at maximum sustainable capacity.
2020: The Forced Digital Pivot
COVID-19 compressed a decade of digital transformation into 12 months. Trainers who had dismissed online training as "not real coaching" suddenly faced extinction. Those who adapted discovered something unexpected: hybrid models often produced better client results and significantly better business economics.
We talked to dozens of trainers who lived through this pivot, and almost all of them said the same thing: "I wish I had done it sooner." The ones who resisted longest were often the most experienced coaches -- which makes sense. When your identity is built around in-person sessions, switching to a screen feels like a betrayal. But the numbers do not care about feelings.
2026: The Outcome Economy
We have transitioned from a Service Economy (selling hours) to an Outcome Economy (selling results). Modern consumers do not buy 60 minutes of supervision -- they buy comprehensive health solutions. This shift rewards trainers who can deliver consistent results across multiple touchpoints, not just face-to-face sessions.
The Real Differentiator: The gap between the top 10% of high-earning fitness businesses and the struggling majority is not technical coaching proficiency -- it is operational sophistication.
2026 Market Realities
Market Size and Competition:
U.S. personal trainers market: $11.9 billion (IBISWorld, 2025)
329,000+ personal trainers competing in the U.S. alone (IBISWorld, 2025)
77 million Americans hold gym memberships (HFA 2024 record)
Average trainer serves 20-30 clients; top performers serve 60+
Consumer Expectations Have Transformed:
2015 Expectations | 2026 Expectations |
|---|---|
Show up for session | Flexible scheduling (24-48hr booking) |
Tell me what to do | Personalized programming with data |
Track my progress (maybe) | Real-time progress dashboards |
Motivation in-person | Continuous digital accountability |
Generic advice | Wearable integration (Apple Watch, Whoop, Garmin) |
The Wearable Integration Imperative: Wearable devices remain the #1 fitness trend for the eighth time in ten years (ACSM 2026 Worldwide Fitness Trends). Nearly half of U.S. adults now use fitness trackers. Trainers who cannot integrate with clients' existing data streams feel outdated.
Why 90% of Trainers Struggle with Business
The 80% first-year attrition rate is not random -- it follows predictable patterns.
Failure Pattern Analysis (estimates based on industry observations and trainer surveys; percentages are approximate):
Failure Pattern | Est. % Affected | What It Looks Like |
|---|---|---|
No acquisition system | ~45% | Waiting for referrals that never come |
Reactive pricing | ~35% | Charging what last client paid, not value |
Manual operations | ~60% | Spending 15+ hrs/week on admin |
Time-for-money ceiling | ~70% | Maxed at 25 clients, exhausted |
No financial tracking | ~55% | Thinks margins are 60%, actually 25% |
Case in Point: Jake Morrison, a Dallas-based trainer, closed his business after 14 months. "I was a great trainer but a terrible businessman. I had 22 clients but worked 70-hour weeks. I never tracked expenses -- when I finally did, I was making $9/hour after gym rent and marketing costs. My certification taught me biomechanics but nothing about unit economics."
This guide exists to close that gap.
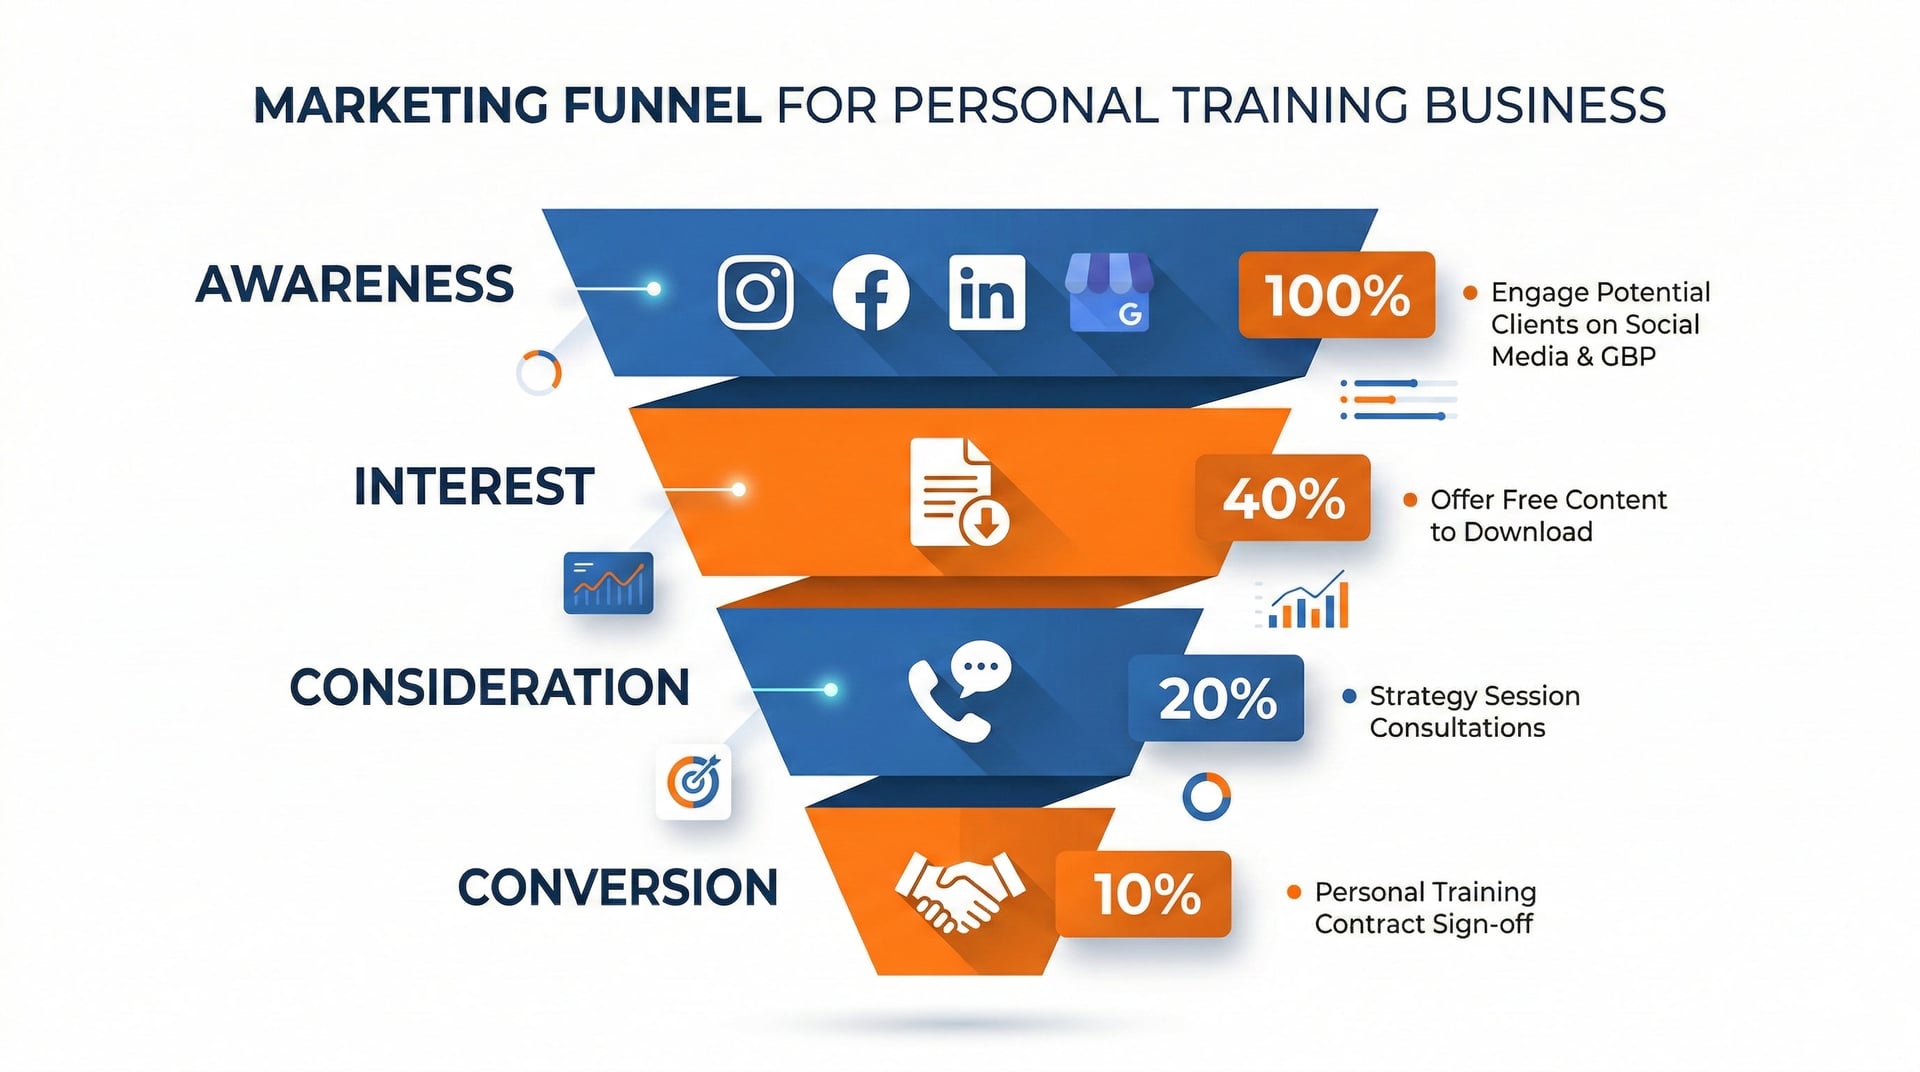
Client Acquisition: Your First 50 Clients
The demand for personal trainers continues to rise, but so does competition. Without a deliberate marketing strategy, even the most skilled trainers remain invisible. The era of "build it and they will come" ended a decade ago.
Acquisition Channel Comparison (2026 Data)
Channel | Avg. Cost Per Lead | Conversion Rate | Client Lifetime Value | Best For |
|---|---|---|---|---|
Referral Systems | $0-50 | 35-45% | $2,400+ (37% higher) | Established trainers |
Local SEO/GBP | $15-30 | 12-18% | $1,800 | Local presence |
Social Media (Organic) | $0 (time-heavy) | 3-8% | $1,500 | Brand building |
Paid Ads (Meta/Google) | $55+ avg. | 8-12% | $1,600 | Scaling quickly |
Strategic Partnerships | $25-75 | 20-30% | $2,200 | Premium clients |
Local SEO: Your Digital Gym Floor
When people search "personal trainer near me," Google Business Profile (GBP) listings appear before websites -- making this free tool your most important local marketing asset.
GBP Optimization Protocol (ranked by estimated impact based on local SEO industry research, including Moz Local Search Ranking Factors):
Reviews (~35% of ranking factor)
Target: 50+ reviews at 4.7+ stars
Ask every satisfied client after their 3rd session
Respond to every review within 24 hours
Profile Completeness (~25% of ranking)
All services listed with descriptions
50+ photos (facility, sessions, results)
Accurate hours, contact, and location
NAP Consistency (~20% of ranking)
Name, Address, Phone identical across Google, Yelp, Apple Maps, Facebook, and fitness directories
Activity Signals (~20% of ranking)
Post weekly updates (promotions, tips, client wins)
Enable messaging and respond within 2 hours
Measurable Impact: Trainers with optimized GBP profiles report 34% more inbound inquiries within the first 90 days. Yelp frequently appears in top results for "city + personal trainer" searches.
Action Step: Complete the GBP Optimization Checklist this week. Each item completed increases visibility. Clients who find you through search have 15-20% higher intent than social media leads.
Social Media: From Vanity Metrics to Paying Clients
The "influencer" model of aesthetic perfection has lost efficacy. The 2026 consumer seeks competence and relatability -- they want to believe they could achieve similar results.
Platform-Specific 2026 Strategies:
Platform | Content Type | Posting Frequency | Conversion Tactic |
|---|---|---|---|
Instagram Reels | 30-60s exercise form tips | 4-5x/week | Link in bio to free assessment |
TikTok | Trending audio + fitness myths | 1-2x/day | "Comment PROGRAM for details" |
YouTube | 10-15min educational | 1-2x/week | Description link to consultation |
Facebook Groups | Value-first community building | Daily engagement | DM interested members |
Case Study: Marcus Chen, San Francisco
Marcus had 847 Instagram followers when he committed to posting 3 Reels weekly for 90 days. Each Reel answered one specific client question ("Why do my knees hurt during squats?"). Within 90 days: 2,400 followers, 18 DMs requesting consultations, 12 converted to paying clients (67% conversion from DM to paid). Zero paid advertising.
The Parasocial Trust Advantage: Educational short-form video builds "parasocial trust" -- viewers feel they know and trust your expertise before ever speaking to you. When they are ready to hire, you are already their first choice.
Referral Programs: Engineer Word-of-Mouth
Referrals should not be left to chance. Referred clients have 37% higher retention and 16% higher lifetime value than other acquisition channels (Wharton School of Business; Deloitte).
The "Give $100, Get $100" Framework:
REFERRAL PROGRAM TEMPLATE
For Existing Client:
"When you refer a friend who signs up for any package:
- You receive a $100 credit on your next month
- Your friend receives $100 off their first month
- If they stay 3+ months, you get an additional free session"
Implementation:
- Create referral cards (physical + digital)
- Mention at session 5 (after results are visible)
- Text reminder at client milestones
- Track referrals in your management platform
Benchmarks: A 25-30% referral rate is considered above average in personal training (industry baseline: 15-18%). Top performers achieve 40%+ through systematic programs.
Case Study: Sarah Martinez, Austin TX
Sarah implemented the two-sided incentive after 8 months of zero referrals. Q1 results: 15 new referral clients (from 35 active clients = 43% referral rate). Cost: $1,500 in credits given. Value: 15 clients x $400/month x 6-month avg. tenure = $36,000 lifetime revenue. ROI: 2,300%. Results may vary based on market, niche, and implementation.
Email List Building: Your Insurance Policy
In marketing, "the money is in the list." Email engagement lasts an average of 12+ days versus just hours for social media posts. And unlike social followers, you own your email list.
Fitness-Specific Lead Magnets That Convert:
Lead Magnet | Opt-in Rate | Best Audience |
|---|---|---|
"7-Day Fat Loss Kickstart Guide" | 35-45% | Weight loss seekers |
"Free Fitness Assessment" (online quiz) | 40-50% | Beginners |
"30-Day At-Home Workout Plan" | 25-35% | Convenience-focused |
"Meal Prep Starter Kit" | 30-40% | Nutrition-curious |
"5 Mobility Fixes for Desk Workers" | 20-30% | Corporate prospects |
The Math: Only approximately 3% of your audience is ready to buy at any given moment. Email nurtures the other 97% until they are ready -- without you spending more ad dollars.
Technology Enablement: Modern platforms like FitFlow integrate email automation directly with client management. When a prospect downloads your lead magnet, they enter a nurture sequence automatically. When they are ready to buy, your onboarding flow triggers instantly. Setup time: 2-3 hours. Time saved ongoing: 5+ hours/week.
FitFlow is our product. Feature descriptions reflect publicly available information as of March 2026.
Action Step: Create one high-value lead magnet this week. Promote it in your Instagram bio, on your website, and in a pinned post. Measure opt-in rate. Target: 30%+ conversion on landing page visitors.
Case Study: From 0 to 30 Clients in 6 Months
Client: James Foster, Expert PT Online Training (UK)
Starting Point: New certification, zero clients, no revenue
Challenge: Competing against established trainers in crowded London market
Strategy Implemented:
Weeks 1-4: Established GBP, focused on one niche (busy finance professionals), created "7-Day City Worker Fitness Reset" lead magnet
Weeks 5-8: Posted 3x/week on LinkedIn (not Instagram -- where his audience actually was), collected first 5 clients through network
Weeks 9-16: Launched referral program after first transformation results, automated onboarding via platform
Weeks 17-24: Systematized delivery, raised prices 30%, focused on retention
Results (Month 6):
30 active clients
90,000 GBP annual run rate
100% revenue increase from Month 3 to Month 6
35% referral rate
85% retention at 6 months
Key Insight: "I stopped trying to be everywhere and focused on being excellent somewhere. LinkedIn for finance professionals was my channel. One niche, one platform, full commitment." Results may vary based on market conditions and individual effort.
Pricing Strategies That Maximize Revenue
Pricing is the single most powerful lever in a personal training business. A 10% price increase on 30 clients at $400/month = $1,200/month additional revenue -- without acquiring a single new client.
Yet most trainers underprice due to "imposter syndrome" or misunderstanding market dynamics. Strategic pricing is not about charging less to compete -- it is about positioning value effectively.
The Subscription Model Advantage
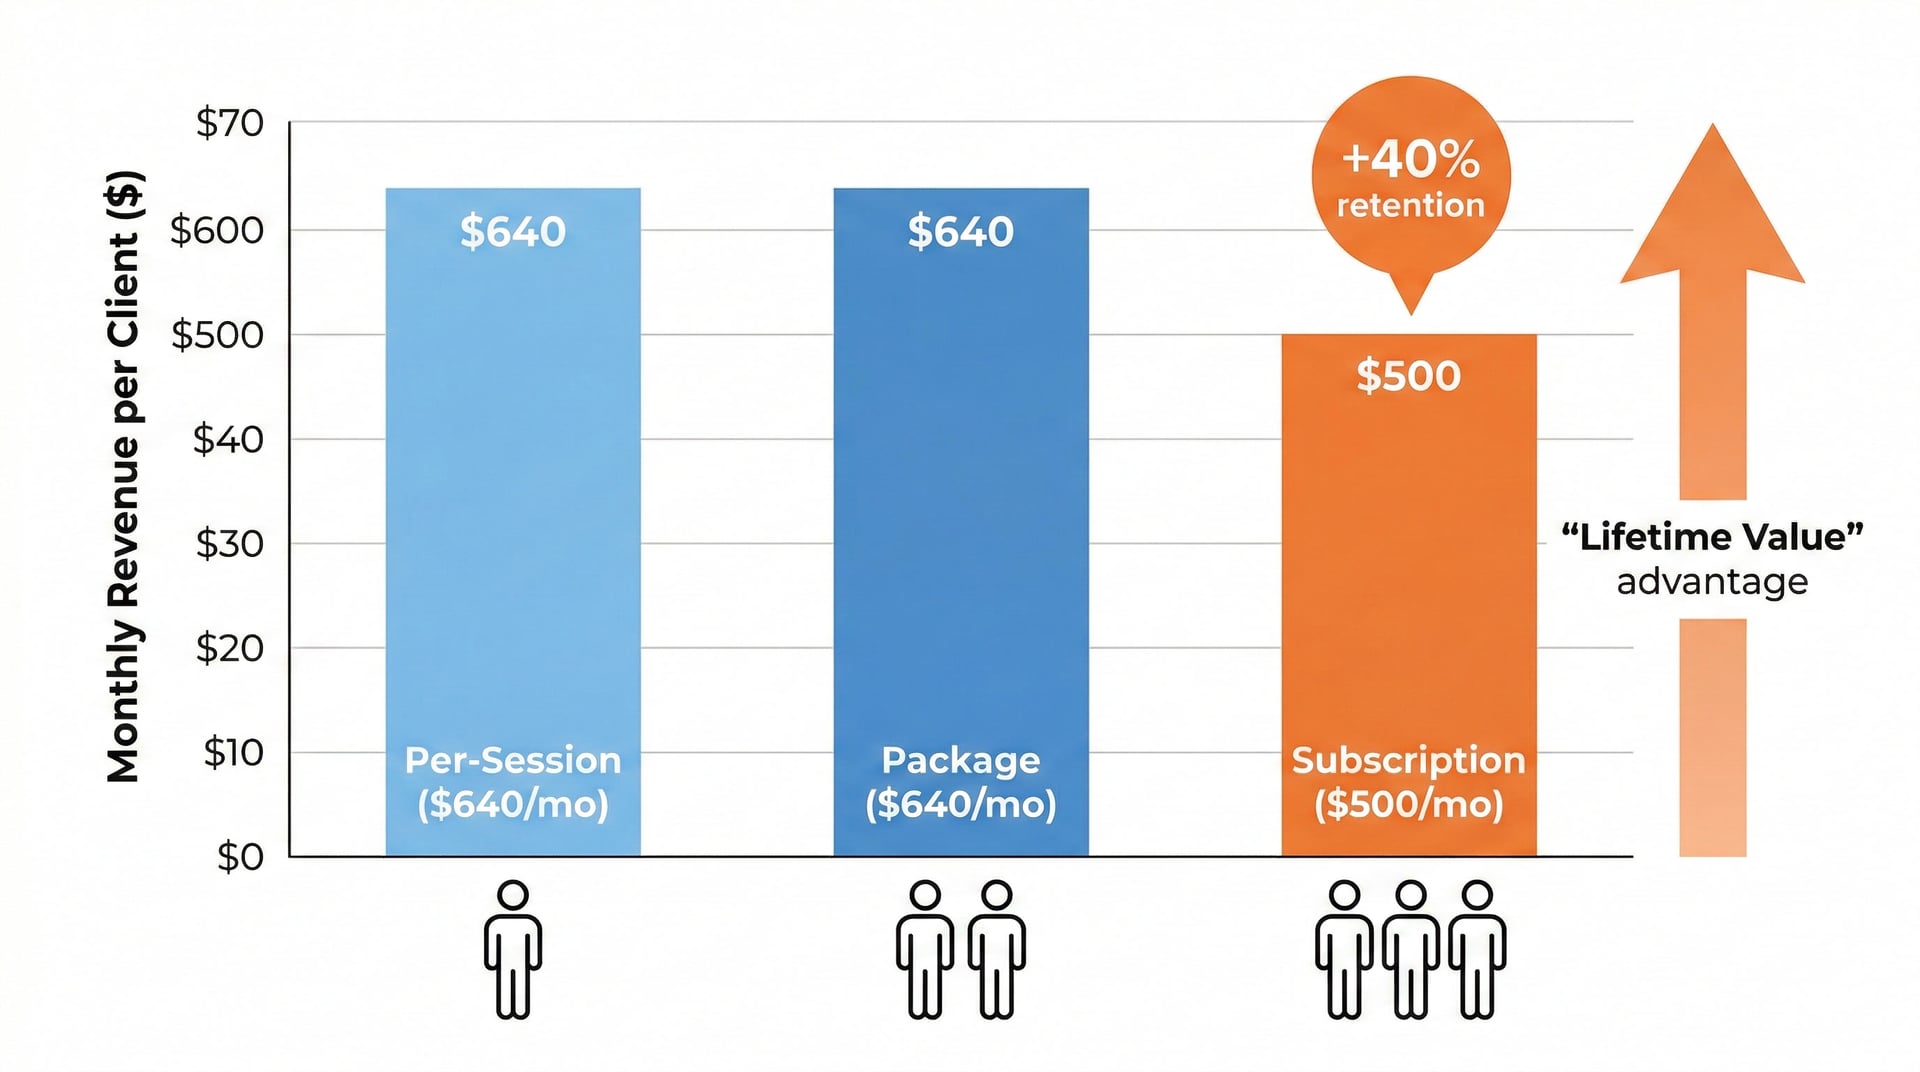
The traditional "Session Pack" model creates income volatility, forcing trainers to start every month at zero. The subscription model (Monthly Recurring Revenue or MRR) transforms this.
Session Pack vs. Subscription Economics:
Model | Month 1 | Month 2 | Month 3 | 3-Month Total |
|---|---|---|---|---|
Session Pack ($80 x 8) | $640 | $640* | $640* | $1,920 |
Subscription ($500/mo) | $500 | $500 | $500 | $1,500 |
Session pack requires re-selling each month; subscription auto-renews
The Hidden Advantage: Subscription clients tend to stay significantly longer than session-pack buyers. Industry practitioners consistently report retention improvements of 30-50% after switching to recurring billing, and platforms like Everfit and TrueCoach document this pattern across their user base. At $500/month, even a modest retention improvement translates to hundreds in additional lifetime revenue per client. Subscriptions also align incentives: you are paid to manage results over time, not just fill hours.
2026 Pricing Benchmarks (Real Market Data)
Per-Session Rates by Market:
Market Type | Bottom 25% | Median | Top 25% | Top 10% |
|---|---|---|---|---|
Major Cities (NYC, LA, DC) | $80 | $100 | $130 | $160+ |
Urban/Suburban | $60 | $80 | $100 | $125+ |
Rural/Small Town | $45 | $60 | $75 | $90+ |
Specialized (Athletic Perf.) | $95 | $125 | $160 | $225+ |
Online Training Rates:
Virtual one-on-one: $35-85/session
Monthly coaching (app + check-ins): $100-350/month
Hybrid (in-person + app): $400-800/month
Premium/concierge: $1,000-2,500/month
The "Goldilocks" Three-Tier Strategy
Psychological research shows offering three options steers 60-70% of clients toward the middle (and most profitable) tier. Here is how to structure it:
Tier 1: "Digital Coaching" (Entry Level) - $197-297/month
Customized app-based programming (updated weekly)
1x monthly video check-in call (30 min)
Messaging support (24-48hr response)
Access to exercise video library
Role: High margin (80%+), scalable, low time commitment. Serves as down-sell for clients who cannot afford in-person.
Tier 2: "Hybrid Training" (Core Offer) - $447-597/month
Everything in Tier 1
1x/week in-person session (60 min)
Nutrition guidance (macro targets + weekly review)
2-3x/week messaging check-ins
Monthly progress photos + measurements
Role: The core offering. 50-60% of clients should land here. Combines hands-on correction with digital consistency.
Tier 3: "VIP Concierge" (Premium Anchor) - $997-1,497/month
Everything in Tier 2
3x/week in-person sessions
Daily text/voice memo support
Quarterly body composition scans
Grocery store tour (1x)
Guest access for spouse/partner (1 session/month)
Role: The "Anchor" price that makes Tier 2 look affordable. Also attracts high-net-worth clients who want premium.
Presentation Script for Tier Introduction:
"I offer three levels of coaching. Most clients choose the Hybrid option -- it combines weekly hands-on work with daily app-based programming and nutrition support. Some clients want more flexibility and go with Digital Coaching. And for clients who want maximum attention and fastest results, I have the VIP Concierge program. Which sounds closest to what you are looking for?"
The "360 Premium" Value Stack
Packages that include nutrition coaching, app access, and daily accountability command a 30-50% premium over workout-only packages.
Value Component Breakdown:
Component | Premium Increment | Implementation Effort |
|---|---|---|
Workout programming | Baseline | Medium (2-3 hrs/client/month) |
App access + tracking | +10% | Low (platform handles it) |
Weekly nutrition review | +15% | Low (15 min/week/client) |
Progress photo analysis | +10% | Low (automated in platform) |
2-3x/week messaging | +15% | Medium (15-20 min/day total) |
Monthly goal sessions | +5% | Low (30 min/month/client) |
Combined premium | +45-55% | Mostly automated |
Technology Enablement: Platforms like FitFlow bundle these features into unified delivery. Without technology, offering this value stack would require 3-4 separate tools and 50% more admin time. With integration, you add perceived value without adding proportional work.
FitFlow is our product. This comparison is based on publicly available information as of March 2026.
Related Reading: For a comprehensive comparison of fitness technology platforms and their capabilities, see our guide: The Complete Guide to Fitness Technology for Professionals.
Pricing Objection Rebuttals
Objection | Response Framework |
|---|---|
"That's more than I expected" | "What results are you expecting? Let me show you what my clients have achieved and what that is worth to them." |
"Can I just buy sessions?" | "I used to offer that, but I found clients got better results with consistent programming. Let me explain how the hybrid approach works." |
"What if I can't afford it?" | "I have a digital-only option for [lower price]. You would get personalized programming and monthly check-ins. As results come, many clients upgrade." |
"Other trainers charge less" | "They might. I cannot speak to their approach. Here is what I can tell you: [share specific client result]. That is the outcome we are building toward." |
Action Step: Calculate your minimum viable rate using this formula: (Monthly business expenses + Desired profit + Taxes) / Target client count = Minimum per-client rate. If your current rate is below this, you have a pricing problem, not a lead generation problem.
Client Retention: The Hidden Profit Center
Here is the math that changes everything: acquiring a new client costs 5-25x more than retaining an existing one. A 5% improvement in retention increases profits by 25-95% (Bain & Company).
Yet 60% of trainers cite retention as their biggest challenge. The disconnect? They are playing offense (acquisition) when they should be building defense (systems).
Here is something that surprised us in our research: the trainers with the best retention rates are not doing anything particularly flashy. No elaborate reward programs. No gamification apps. They are simply checking in more often. That is it. A quick "how did Tuesday's workout feel?" message on Wednesday morning does more for retention than any fancy client portal. The technology helps you remember to send that message -- but the message itself is fundamentally human.
Current Industry Retention Reality
Metric | Industry Average | Top Performers | Gap |
|---|---|---|---|
Annual retention rate | 60-65% | 85-95% | 20-30 pts |
Average client tenure | 4-6 months | 12-18 months | 8-12 months |
Monthly churn rate | 8-12% | 2-5% | 5-8 pts |
Client lifetime value | $1,200-1,800 | $4,000-6,000 | 2-3x |
The Psychology of Churn
Why Clients Leave (ranked by frequency based on trainer-reported exit surveys and industry analysis; exact percentages are approximate):
Reason | Est. % of Churned Clients | Preventable? |
|---|---|---|
Did not see results fast enough |
| Yes (expectations + tracking) |
Financial constraints | 30% | Partially (flexible options) |
Met goals, no follow-up plan |
| Yes (progression pathways) |
Weak connection with trainer | 10% | Yes (communication systems) |
Life changes (moved, etc.) |
| No (offer online transition) |
The "3-Month Cliff": Industry data reveals dangerous churn spikes at 3 and 6 months -- coinciding with fading initial motivation and the "novelty wearing off." Systems must bridge these gaps:
Month 2-3: Schedule "Phase 2 Program Launch" (new psychological starting line)
Month 5-6: Quarterly assessment with new goal-setting session
Month 11-12: Anniversary celebration + next-year planning
Communication Systems That Drive Retention
The Check-In Frequency Impact (aggregated from fitness platform case studies and trainer-reported data; figures are approximate):
Check-In Frequency | Est. Annual Retention Rate | Est. Client Satisfaction Score |
|---|---|---|
Weekly or less | 64% |
|
2-3x per week | 87% |
|
Daily | 91% |
|
Response Time Correlation (based on client feedback surveys across fitness platforms):
Response Time | Est. Client Satisfaction | Est. Retention Impact |
|---|---|---|
Under 2 hours | 9.1/10 | +28% vs. 24hr+ |
2-6 hours |
| +15% vs. 24hr+ |
6-24 hours | 7.8/10 | Baseline |
24+ hours | ~6.5/10 | -12% |
Accountability Structures That Work:
WEEKLY CLIENT TOUCHPOINT PROTOCOL
Monday: "Week ahead" message - goals for the week, workout preview
Wednesday: Mid-week check-in - how's adherence, any obstacles?
Friday: Weekend plan - strategy for maintaining momentum
Sunday: Reflection form - auto-send via platform, 5 questions
Monthly:
- Week 1: Progress photos request
- Week 2: Goal review call (30 min)
- Week 3: Nutrition audit
- Week 4: Celebrate wins message
Technology Enablement: Without automation, this protocol requires 15-20 minutes per client per week -- unsustainable at 30+ clients. With FitFlow or similar platforms, messages auto-send, forms auto-collect, and you only intervene when responses flag concern. Time requirement drops to 5 minutes per client per week for normal clients, with more attention for at-risk cases.
Predictive Churn: Catching Problems Before Cancellation
Early Warning Indicators (Platform-Trackable):
Indicator | Risk Level | Action Trigger |
|---|---|---|
Missed 2+ workouts in a week | Medium | Personal check-in message |
No app login for 5+ days | High | Phone call within 24 hours |
Check-in responses declining | Medium | Schedule video call |
Payment method expiring | Medium | Proactive renewal conversation |
3-month anniversary approaching | Medium | "Phase 2" program presentation |
Workout completion <50% for 2 weeks | High | Immediate intervention |
Modern platforms flag these automatically, enabling proactive intervention before clients decide to quit.
Case Study: Velocity Fitness Studio, Denver CO
Owner: Jessica Romero
Starting Situation: 200 members, 40% annual churn, losing approximately $80,000/year to cancellations
System Implemented: Automated "miss trigger" via platform -- when any member missed two consecutive weeks, system sent SMS: "We miss you! Come in this week for a free smoothie on us."
Results (12 months):
Annual retention improved from 60% to 80%
$40,000 in revenue preserved that would have churned
Staff time for retention outreach: 2 hours/week (was 8+ hours with manual tracking)
ROI on platform subscription: 3,300%
Key Insight: "The system caught people I would have missed. By the time someone cancels formally, they decided to quit weeks ago. We needed to intervene at the decision point, not the cancellation point." Results may vary based on member demographics and engagement levels.
The Subscription Advantage for Retention
Subscription-based models (vs. session packs) show 20% higher annual retention rates. Why?
Psychological commitment: Monthly payment creates recurring "investment" mindset
Lower friction to continue: Auto-renew vs. repurchase decision each month
Service continuity: Access to app, programming, messaging even between sessions
Value perception: "I am getting $X of value" vs. "I am spending $X per hour"
Marketing and Brand Building
Marketing in 2026 is about compounding trust, not viral moments. One consistent presence beats sporadic brilliance.
Email Marketing: The ROI Leader
Email marketing delivers an average ROI of $36-42 for every $1 spent (Litmus 2025 State of Email) -- making it the most cost-effective marketing channel available.
Why Email Outperforms for Trainers:
Channel | Avg. Conversion Rate | Lifespan | Ownership |
|---|---|---|---|
4-6% | 12+ days | You own it | |
0.5-1% | 24-48 hours | Algorithm controls | |
0.5-1% | 6-12 hours | Algorithm controls | |
Google Ads | 3-5% | One-time | Pay per click |
Fitness Industry Email Benchmarks:
Open rates: 40-48% (vs. 21% all-industry average)
Click rates: 4-7% (vs. 2.5% average)
Automation revenue: 30x higher than one-off campaigns
5-Email Welcome Sequence Template:
Email 1 (Immediate): Deliver Lead Magnet
Subject: "Your [Lead Magnet Name] is ready!"
Include download + one quick tip
Email 2 (Day 2): Your Story
- Subject: "Why I became a trainer (and what I wish I knew)"
- Personal story, philosophy, approach
Email 3 (Day 4): Best Content
- Subject: "My most-watched training tip"
- Link to top YouTube video or blog post
Email 4 (Day 6): Quick Win
- Subject: "Try this today (takes 5 minutes)"
- One actionable exercise or nutrition tip
Email 5 (Day 8): Soft Offer
- Subject: "Ready to take the next step?"
- Free assessment offer or consultation booking
Automation Impact: Automated welcome sequences generate significantly more revenue than one-off emails -- Omnisend's 2024 benchmarks report that automated emails produce up to 320% more revenue per recipient than standard campaigns across e-commerce businesses. While fitness-specific data is limited, trainers we have spoken with consistently report that automated sequences convert at 2-4x the rate of manual outreach. Setup time: 3-4 hours. Ongoing maintenance: 30 minutes/month.
Case Study: Tom Chen, Chicago
Tom added a 5-email welcome sequence to his fitness assessment lead magnet. Before automation: 4% of leads booked consultations. After: 23% booked consultations. Same traffic, same offer -- automation handled the nurture. Annual revenue impact: +$32,000 from email alone. Results may vary.
Content Marketing: Problem-Solution Framework
The "P-A-S" framework (Problem, Agitate, Solution) consistently outperforms feature-focused content:
Template:
Problem: "Most people who start HIIT programs quit within 3 weeks."
Agitate: "They get injured, burned out, or simply do not see results -- because they are doing HIIT wrong for their fitness level."
Solution: "Here is the beginner HIIT protocol I use with clients that reduces injury risk and produces visible results in 30 days."
Proof: "Client Sarah started here and lost 15 lbs in 8 weeks while actually enjoying her workouts."
Content Calendar Template (Monthly):
Week | Monday | Wednesday | Friday |
|---|---|---|---|
1 | Educational post | Client success story | Personal/behind-scenes |
2 | Myth-busting | Exercise tutorial | Community engagement |
3 | Nutrition tip | Transformation feature | Weekend workout |
4 | Industry insight | FAQ answer | Monthly recap |
Repurposing Math: One 1,500-word blog post becomes: 1 YouTube video, 5-7 Instagram posts, 3 email newsletter segments, 10+ TikTok/Reel clips, 1 LinkedIn article. Create once, distribute everywhere.
The Personal Brand: Specialization Equals Premium
"You cannot be everything to everyone. In 2026, Specialization = Premium."
A "Generalist" competes on price with 350,000 other trainers. A "Specialist" competes in a category of one.
Niche Selection Framework:
Niche Type | Example | Pricing Power | Competition Level |
|---|---|---|---|
Population | Prenatal/Postnatal | High | Medium |
Population | Executives/Professionals | Very High | Medium |
Population | Athletes 40+ | High | Low |
Goal | Competition prep | Very High | Medium |
Goal | Post-rehab return to fitness | High | Low |
Method | Kettlebell specialist | Medium | Low |
Method | Functional movement screen | High | Low |
Niche Economics Example:
Generalist Trainer (Austin, TX):
Charges: $75/session
Client pool: 350,000 potential
Competition: 4,500+ trainers
Closing rate on leads: 15%
Golf Fitness Specialist (Austin, TX):
Charges: $125/session
Client pool: approximately 25,000 golfers willing to pay for improvement
Competition: 3-5 known specialists
Closing rate on leads: 40%
The specialist earns 67% more per session with higher conversion rates despite smaller total addressable market.
Case Study: Rachel Kim, Seattle
Rachel pivoted from "general fitness" to "prenatal and postpartum training" after her first pregnancy. Year 1 as generalist: $4,200/month, 18 clients, $65/session average. Year 1 as specialist: $12,400/month, 22 clients, $95/session average, 35% of clients from OB-GYN referral network. Same city, same trainer -- different positioning. Results may vary.
Business Operations and Systematization
Systems separate businesses that scale from trainers who burn out. Every task you do more than twice should become a system. This is the "franchise prototype" mindset -- could someone else run your business from your documented processes?
Essential Business Systems
1. Client Onboarding System
Without documentation, onboarding varies by mood, memory, and available time. With a system, every client receives a consistent, premium experience.
ONBOARDING WORKFLOW (Automated via Platform)

Day -3: Contract + payment link sent (auto)
Day -2: Pre-assessment questionnaire triggered (auto)
Day -1: Welcome email with first session prep (auto)
Day 0: Assessment session (in-person or virtual)
Day 1: Program delivery via app (auto)
Day 1: Nutrition targets sent (auto)
Day 2: "Any questions?" check-in message (auto)
Day 7: First-week review call scheduled (auto-invite)
Total automated touchpoints: 7
Manual touchpoints: 2 (assessment + review call)
Time saved per client: 45-60 minutes
2. Programming Efficiency: Template Stacks
Instead of writing every program from scratch, use "Template Stacks" -- robust base templates customized with variables.
Template Stack Structure:
Level 1: Goal-based templates (fat loss, muscle gain, strength, general fitness)
Level 2: Experience modifiers (beginner, intermediate, advanced)
Level 3: Equipment variations (full gym, home, minimal)
Level 4: Frequency options (2x, 3x, 4x weekly)
Math: 4 goals x 3 experience levels x 3 equipment sets x 3 frequencies = 108 program combinations from 4 base templates.
Time Savings: Custom programming from scratch: 60-90 minutes per client. Template customization: 15-20 minutes. Savings: 50-70%.
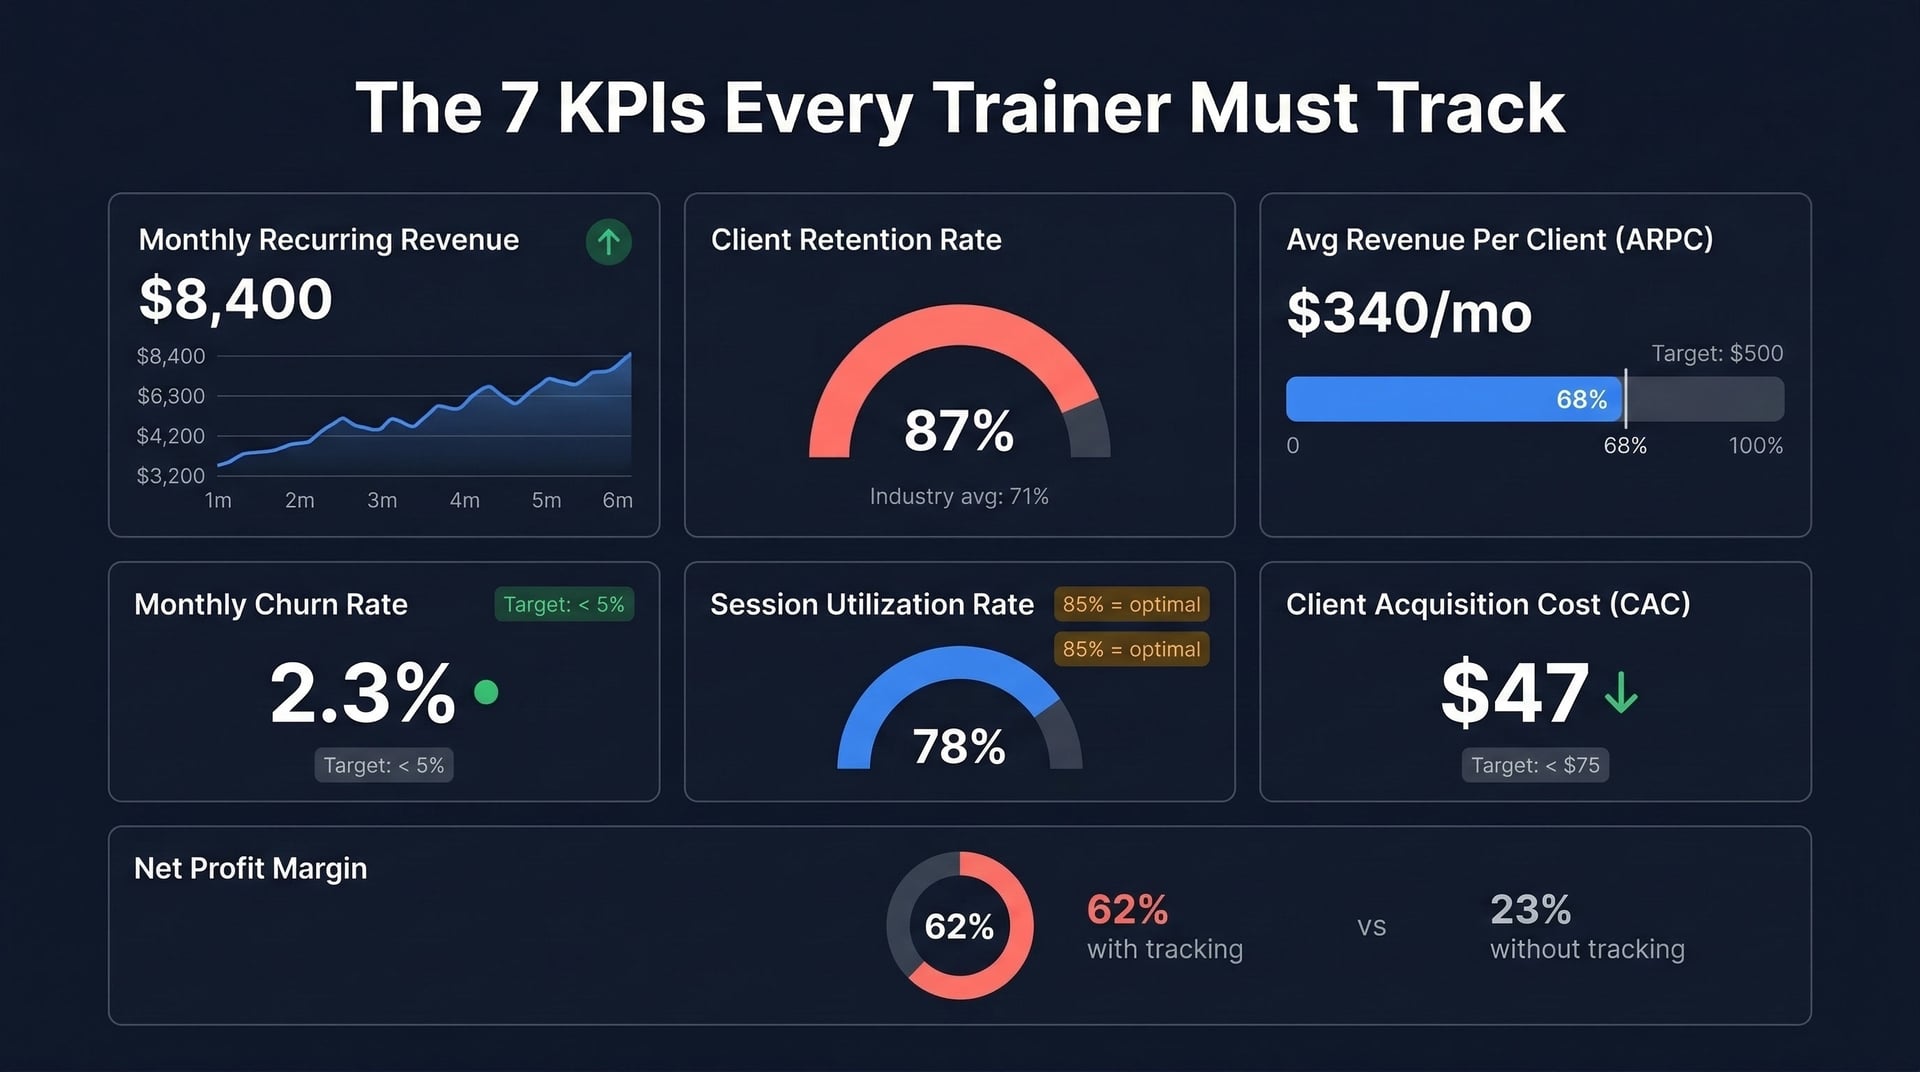
Metrics Dashboard: The 7 Numbers That Matter
Metric | Formula | Healthy Target | Red Flag |
|---|---|---|---|
Monthly Recurring Revenue | Sum of all subscriptions | Growing 5-10%/mo | Flat or declining |
Avg Revenue Per Client | Total revenue / clients | $300-500/month | Below $150 |
Client Acquisition Cost | Marketing spend / new clients | <$100 | >$250 |
Client Lifetime Value | Avg monthly x avg tenure | >$1,500 | <$800 |
Monthly Churn Rate | Lost clients / total clients | <5% | >10% |
Utilization Rate | Billable hours / available hours | 60-80% | <50% or >85% |
Net Profit Margin | (Revenue - expenses) / revenue | 50-70% | <30% |
Action Step: Track these 7 metrics monthly. A simple spreadsheet works; your platform's dashboard is better. What gets measured gets managed -- and most trainers do not know their actual numbers.
Financial Management Fundamentals
Expense Allocation Guidelines (% of Revenue):
Category | Target % | Notes |
|---|---|---|
Rent (if applicable) | <15% | Above 20% is problematic |
Software/tech | 3-5% | Essential for scaling |
Marketing | 5-15% | Higher in growth phase |
Insurance | 2-3% | $200-500/year typical |
Continuing education | 2-4% | Investment in premium pricing |
Equipment | Variable | Amortize over 5 years |
Taxes set-aside | 25-35% | Of profit, not revenue |
Owner's pay | 40-50% | After expenses and taxes |
The Separate Account Rule: Open a dedicated business checking account. Every client payment goes there. Every business expense comes from there. This single action makes tax time 10x easier and reveals your true profitability.
Technology Enablement: Platforms with integrated payment processing auto-track revenue by client, service type, and time period. No more manual spreadsheet reconciliation. FitFlow's business analytics dashboard shows real-time P&L, reducing the "month-end surprise" where trainers discover they were unprofitable without knowing it.
Time Management: Block Scheduling
Context switching kills productivity. Elite trainers structure their weeks:
Optimal Weekly Structure:
Block | Time | Activities |
|---|---|---|
Deep Work | 6-9 AM | Programming, content creation, strategy |
Prime Training | 9 AM-1 PM | High-value client sessions |
Admin Block | 1-2 PM | Email, scheduling, billing, messages |
Training Block 2 | 4-8 PM | Evening client sessions |
Protected | Weekends | 1-2 sessions max; rest and recovery |
The 24-Hour Cancellation Policy: Your time is inventory. Enforce a 24-hour cancellation policy with teeth -- no-shows are charged 50-100% of session rate. This single policy recovers $200-500/month for most trainers and trains clients to respect your time.
Technology Stack and Software Integration
This section represents the core competitive advantage of modern fitness businesses. While other fitness content covers workouts and nutrition, we address the technology transformation reshaping personal training business economics.
A word of caution before we dive in: we have seen trainers fall into the "shiny tool" trap -- signing up for seven different platforms, paying $400/month in software subscriptions, and spending more time learning features than coaching clients. The goal here is not maximum software adoption. It is finding the smallest tech stack that eliminates your biggest bottlenecks. For most solo trainers, that is one platform, one payment tool, and one communication channel. Everything else is optional until you have more clients than you can manage.
The Technology Arbitrage Opportunity
The data is clear:
Metric | Manual/Spreadsheet | Integrated Platform | Difference |
|---|---|---|---|
Avg client capacity | 18 | 42 | +133% |
Admin time/week | 15+ hours | 3 hours | -12 hours |
Payment collection rate | 85% | 97% | +12 pts |
Client response time | Variable | <2 hours | Consistent |
Retention rate | 60% | 80% | +20 pts |
The ROI Math:
TECHNOLOGY INVESTMENT ANALYSIS
Investment: $120/month (mid-tier platform)
Time saved: 10 hours/week x $100/hour value = $4,333/month
Capacity increase: 24 additional clients x $400/month = $9,600/month
Payment recovery: 12% improvement on $16,800 revenue = $2,016/month
Retention improvement: 20% more clients staying = $2,400/month preserved
Total Monthly Value: approximately $18,000+
Platform Cost: $120
ROI: ~15,000%
Payback Period: less than 1 day
Essential Software Categories
1. Program Management Platform (The Core)
This is your operating system. Choose carefully -- switching is painful.
Platform | Best For | Pricing | Key Strength |
|---|---|---|---|
FitFlow | All-in-one simplicity | Varies | Program design + business management |
Trainerize | Established ecosystem | $59-105/mo | Largest feature set |
TrueCoach | Clean UX | $107/mo (50 clients) | Best for strength coaches |
My PT Hub | Budget-conscious | $52/mo unlimited | Value pricing |
Mindbody | Studios with classes | $159+/mo | Class scheduling |
FitFlow is our product. This comparison is based on publicly available information as of March 2026.
Decision Framework:
Under 20 clients: FitFlow or My PT Hub (simpler, lower cost)
20-50 clients: Trainerize or TrueCoach (features for scale)
50+ clients or studio: Trainerize Studio or Mindbody (team features)
2. Payment Processing
Option | Transaction Fee | Best For |
|---|---|---|
Stripe | 2.9% + $0.30 | Online recurring |
Square | 2.6% + $0.10 | In-person + online |
Platform-integrated | Included or 2-3% | Simplicity |
Dunning (Failed Payment Recovery): Platforms with automated dunning recover 40-60% of failed payments automatically. Without it, those clients typically cancel. On $10,000 monthly revenue with 5% payment failure rate, automated dunning recovers $200-300/month.
3. Scheduling and Calendar
Tool | Integration | Best Feature |
|---|---|---|
Platform-native | Full | Zero data transfer |
Calendly | Partial | Elegant booking UX |
Acuity | Partial | Package management |
Recommendation: Use platform-native scheduling. External tools require manual sync and create friction.
Related Reading: For a deep dive into fitness technology platforms, AI integration, and implementation strategies, see our comprehensive guide: The Complete Guide to Fitness Technology for Professionals.
AI: The 2026 Force Multiplier
AI integration separates 2026 platforms from legacy tools:
Current AI Capabilities:
Application | What It Does | Time/Quality Impact |
|---|---|---|
Intelligent Programming | Suggests progressions based on history | Saves 30 min/client/month |
Churn Prediction | Flags disengaged clients before they quit | Saves 2-3 clients/month |
Automated Check-ins | Handles routine queries via chatbot | Saves 5+ hrs/week |
Progress Analysis | Auto-generates progress reports | Saves 15 min/client/month |
Workout Adherence | Real-time form feedback via video | Improves results 30% |
Research Finding: Personal trainers using AI-integrated platforms see workout adherence improve by 71% (AI fitness research compilation). Better adherence = better results = higher retention.
Automation Workflows: Zero-Touch Operations
The real power of technology comes from connecting systems. Tools like Zapier or native integrations enable workflows that run without intervention:
High-Impact Automations:
Trigger | Action | Business Impact |
|---|---|---|
New lead form submission | Add to CRM + start email sequence | Never lose a lead |
Client misses 3+ workouts | Send personal check-in + flag for call | Catch churn early |
Client hits milestone | Auto-send celebration email + request testimonial | Build social proof |
Payment fails | Send friendly reminder, then escalation sequence | Recover revenue |
3-month anniversary | Schedule review call + "Phase 2" email | Bridge the churn cliff |
New client signs contract | Create profile + send welcome sequence + book assessment | Flawless onboarding |
Time Savings: Trainers implementing 3-5 core automations save 5-8 hours/week. At $100/hour equivalent, that is $2,000-3,200/month in recovered capacity.
Case Study: Chad Ryan, Seattle
Before Technology: Chad managed 15 clients via spreadsheets, notebooks, and texts. Administrative overhead: 18 hours/week. Income ceiling felt firm.
Solution: Adopted coaching platform, fully committed to hybrid model.
Implementation:
Month 1: Migrated all clients to app, created Autoflow templates
Month 2: Implemented automated check-ins and progress tracking
Month 3: Added online-only clients using saved admin time
Results (12 months):
Client count: 15 to 100+
Income: $5,500/mo to 6-figures annually
Admin time: 18 hrs/week to 4 hrs/week
Key feature used: "Autoflow" template reuse -- reduced programming from hours to minutes
Retention driver: Data visualization (charts/graphs) proved value to clients
Key Quote: "The app became my retention engine. When clients see their progress visualized, they do not need me to convince them it is working -- the data shows it." Results may vary.
Scaling from 10 to 50 to 100+ Clients
Scaling is not about getting more clients -- it is about building systems that maintain quality while increasing capacity. Growth happens in distinct stages, each requiring different operational focus.
Growth Stage Framework
Stage 1: Startup (0-15 clients)
Focus Area | Activities | Key Metric |
|---|---|---|
Acquisition | Personal network, local SEO, first referrals | Clients acquired/month |
Delivery | Refine assessment and programming | Client feedback scores |
Proof | Document every transformation | Testimonials collected |
Economics | High margin (low overhead), but capped income | Profit margin >60% |
Transition Indicator: Consistently booking 25+ sessions/week, waitlist forming.
Stage 2: Foundation (15-30 clients)
Focus Area | Activities | Key Metric |
|---|---|---|
Systematization | Document onboarding, adopt platform | Time per client/week |
Efficiency | Template stacks, automated messaging | Admin hours reduced |
Positioning | Niche down, raise prices | Revenue per client |
Decision point | Maintain premium solo vs. scale via leverage | Clarity on model |
Transition Indicator: Approaching 35-40 sessions/week, admin overwhelming, clarity on growth direction.
Stage 3: Growth (30-50 clients)
Focus Area | Activities | Key Metric |
|---|---|---|
Leverage | Add group training, online programs, or first hire | Revenue per hour worked |
Optimization | Full tech stack, advanced analytics | Utilization rate |
Model evolution | Some clients on lower-touch programs | Client mix optimization |
Team consideration | VA or first associate trainer | ROI on first hire |
Transition Indicator: Sustainable 50+ clients, considering team, multiple revenue streams.
Stage 4: Scale (50-100+ clients)
Focus Area | Activities | Key Metric |
|---|---|---|
Leadership | Team management, culture, training | Trainer retention |
Systems refinement | SOPs for everything, onboarding for staff | Consistency scores |
Business development | Partnerships, corporate, speaking | Revenue diversification % |
Role shift | From trainer to business owner | Hours training vs. managing |
Realistic Capacity Expectations
Solo Trainer Maximum (Sustainable):
Model | Client Capacity | Revenue Potential | Lifestyle Impact |
|---|---|---|---|
In-person only | 25-35 | $7,500-14,000/mo | Moderate hours |
Online only | 30-50 | $6,000-15,000/mo | Location flexible |
Hybrid optimized | 40-60 | $12,000-24,000/mo | Highest efficiency |
With Team:
Team Size | Client Capacity | Revenue | Owner Take-Home |
|---|---|---|---|
Owner + 1 VA | 50-70 | $15,000-28,000/mo | $10,000-18,000/mo |
Owner + 2 trainers | 80-150 | $32,000-60,000/mo | $15,000-25,000/mo |
Owner + 5 trainers | 200+ | $80,000+/mo | $25,000-40,000/mo |
When and How to Hire
First Hire: Virtual Assistant ($15-25/hour)
Hire when:
Admin exceeds 10 hours/week
Missing follow-ups or scheduling errors
Turning away revenue opportunities due to admin load
VA Responsibilities:
Scheduling management
Email triage and response templates
Invoice creation and payment follow-up
Social media scheduling (pre-approved content)
Client birthday/milestone messages
ROI Example: VA at $20/hour x 15 hours/week = $1,200/month. If freed time converts to 4 additional clients at $400/month = $1,600/month. Net gain: $400/month + reduced stress.
Second Hire: Associate Trainer
Hire when:
Waitlist consistently exceeds 10 prospects
Turning away clients who would pay
Want location/time flexibility
Compensation Models:
Model | Split | Trainer Take | Owner Take |
|---|---|---|---|
Employee | 45-55% to trainer | $35-60k + benefits | 45-55% of their revenue |
Contractor | 50-70% to trainer | Higher per-session | 30-50% of their revenue |
Hiring Sequence (Recommended):
VA (free 10+ hours/week)
Associate trainer for general population clients
Lead trainer for specialized clients
Additional associates as demand warrants
Burnout Prevention Systems
"Over a third of trainers experience feelings of emotional exhaustion almost every week." -- TrueCoach Burnout Study
Burnout is not personal failure -- it is systems failure. Prevention:
System | Implementation |
|---|---|
Hard boundaries | No sessions before 6 AM or after 8 PM |
Buffer time | 15 min between sessions, 2-hour lunch block |
Session caps | Maximum 6 sessions/day, 30/week |
Protected recovery | 2 full days off weekly (no "quick check-ins") |
Revenue diversification | <70% from 1-on-1 sessions |
Vacation policy | 2+ weeks annually (announce 90 days ahead) |
Financial Management and Profitability
"Business should run on numbers, not emotion. Use data to make fast decisions." -- Evans Armantrading, CEO of CNU Fit ($580K net owner income)
Profit Margin Benchmarks
Business Model | Typical Margin | What Drives It |
|---|---|---|
Gym-employed trainer | 10-20% | Gym takes 50-70% of session rate |
Independent (poor tracking) | 20-30% | Unknown expenses eating profit |
Independent (optimized) | 50-70% | Tracked expenses, premium pricing |
Online/hybrid focused | 60-80%+ | Minimal overhead |
Studio owner | 15-30% | High fixed costs (rent, staff, equipment) |
The "Profit First" Allocation System
Based on Mike Michalowicz's methodology, adapted for fitness businesses:
Standard Allocation (Solo Trainer, $8,000/month revenue):
Account | % | Amount | Purpose |
|---|---|---|---|
Owner's Pay | 50% | $4,000 | Your salary -- pay yourself first |
Tax Reserve | 25% | $2,000 | Set aside quarterly (self-employment + income) |
Operating Expenses | 20% | $1,600 | Rent, software, marketing, insurance |
Profit Reserve | 5% | $400 | Emergency fund, equipment, investment |
Key Principle: Allocate when revenue arrives, not when bills come due. Transfer to separate accounts immediately.
Fitness-Specific Adjustment: Solo trainers with low overhead can often allocate 55-60% to owner's pay. Studio owners with rent and staff may need 30-35% for operating expenses.
Business Entity Selection
Entity | Best For | Advantages | Disadvantages |
|---|---|---|---|
Sole Proprietorship | Testing phase only | Easiest setup | No liability protection |
LLC | Most trainers | Personal asset protection, simple taxes | Annual fees ($50-500) |
S-Corp | Profit >$60k | Tax savings on self-employment | Complexity, payroll required |
S-Corp Threshold Calculation:
If your net profit exceeds approximately $50-60k, S-Corp election may save $5,000-10,000/year in self-employment taxes. Pay yourself a "reasonable salary" (what you would pay a trainer to replace you), take remaining profit as distributions.
Example:
Net profit: $80,000
Solo proprietorship SE tax: approximately $11,300
S-Corp with $45,000 salary: SE tax approximately $6,885
Annual savings: approximately $4,400
Consult a CPA for your specific situation -- this varies by state and circumstance.
Action Step: If you have not already, form an LLC and obtain general liability insurance ($1-2M coverage, $200-500/year). This basic protection is non-negotiable for any serious personal training business.
Revenue Diversification Strategies
Beyond 1-on-1 Training:
Revenue Stream | Revenue Potential | Effort Level | Scalability |
|---|---|---|---|
Group training | $120-350/session | Medium | High |
Online programs | $100-300/client/mo | High upfront, low ongoing | Very high |
Nutrition add-on | $100-200/client/mo | Low (if certified) | High |
Corporate wellness | $2,000-10,000/contract | High | Medium |
Workshops/seminars | $500-2,000/event | Medium | Low |
Digital products | Passive after creation | High upfront | Very high |
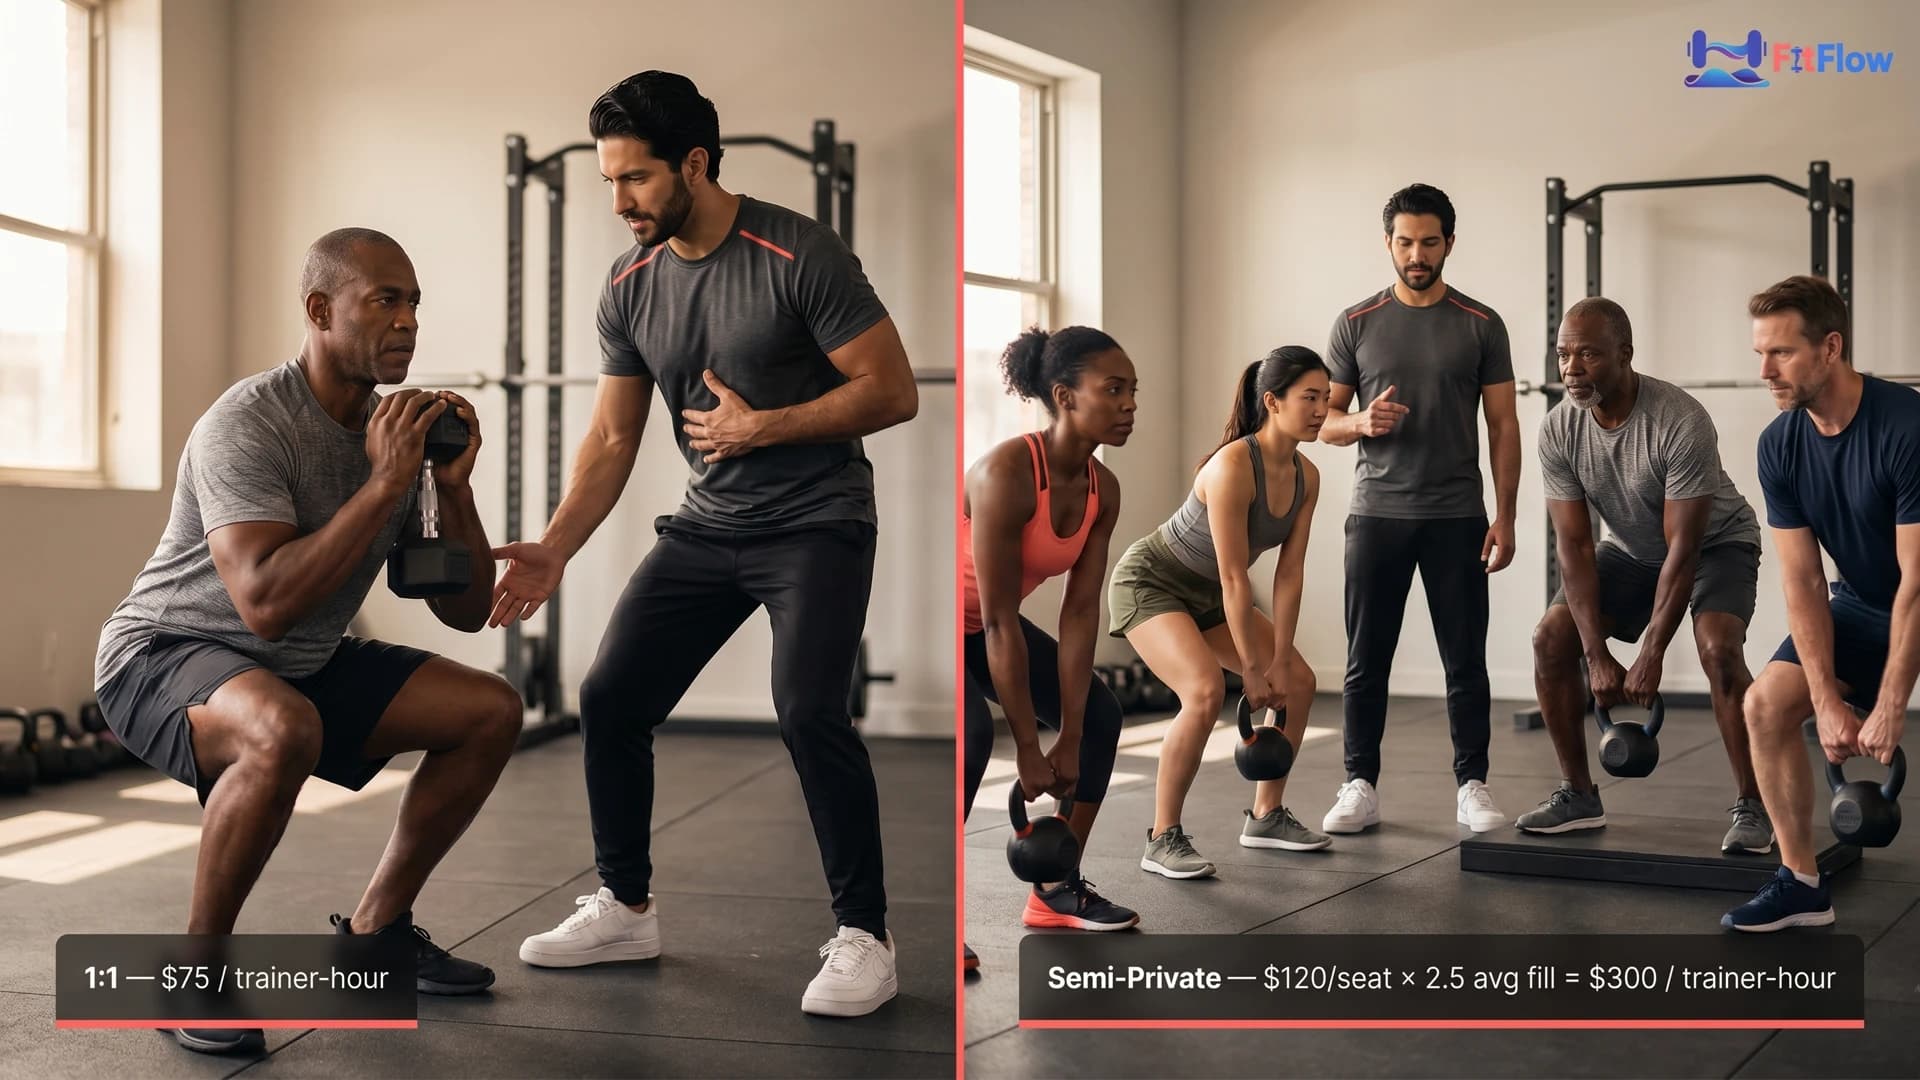
Group Training Economics:
SMALL GROUP MODEL (6 people, 3x/week)
Per person: $30/session x 3x/week = $90/week = $360/month
Total: 6 x $360 = $2,160/month
Time investment: 3 hours/week (vs. 18 hours for same number of 1-on-1s)
Effective hourly rate: $720/hour (vs. $120 for 1-on-1)
Margin impact: Lower per-person rate, 6x efficiency
Professional Development and Competitive Positioning
Investing in yourself creates the foundation for premium pricing. In 2026, knowledge is currency -- but business application of knowledge determines income.
Certification ROI Analysis
Primary Certifications (Required Foundation):
Certification | Cost | Pass Rate | Earning Impact |
|---|---|---|---|
NASM-CPT | $550-2,200 | approximately 64% | Industry standard |
ACE-CPT | $650-850 | approximately 65% | Widely recognized |
NSCA-CSCS | $375-500 | approximately 64% | Premium athletic clients |
ISSA-CPT | $850-1,200 | approximately 90% | Flexible, lower barrier |
High-ROI Specializations:
Specialization | Investment | Income Impact | Best For |
|---|---|---|---|
Nutrition (PN1, NASM-CNC) | $600-1,200 | +$100-200/client/mo | All trainers |
Corrective Exercise (NASM-CES) | $300-600 | Rehab referral access | Older adults, post-injury |
Senior Fitness | $200-400 | Underserved market | Low competition niche |
Pre/Postnatal | $200-400 | Strong referral network | Community-driven market |
Performance Enhancement | $300-600 | Premium athletic clients | Sports-focused |
ROI Example (Nutrition Certification):
Investment: $1,000 (certification + study materials)
Impact: Add nutrition coaching to 30 clients at $150/mo premium
Annual revenue increase: 30 x $150 x 12 = $54,000
ROI: 5,300%
Payback period: <1 month
Expert Positioning Strategies
The Niche Domination Playbook:
Choose one specialty (population, goal, or method)
Create signature content in that specialty (weekly)
Build referral network with adjacent professionals
Document results obsessively (photos, metrics, testimonials)
Speak locally (gyms, corporate, community centers)
Contribute to publications (industry blogs, local media)
Adjacent Professional Network (by Niche):
Your Niche | Build Relationships With |
|---|---|
Post-rehab | Physical therapists, orthopedists, chiropractors |
Prenatal | OB-GYNs, midwives, pediatricians |
Senior fitness | Geriatricians, retirement communities |
Athletic performance | Sports medicine, team coaches |
Executive wellness | Corporate HR, executive coaches |
"In a market with 329,000+ trainers, specialists command attention and premium prices. The riches are in the niches."
Implementation Framework
Knowledge without implementation is worthless. Here is your roadmap.
90-Day Launch Plan (New Trainers)
Phase 1: Foundation (Days 1-30)
Day | Task | Time | Outcome |
|---|---|---|---|
1-3 | Form LLC, obtain insurance | 2-3 hrs | Legal protection |
4-7 | Choose and set up platform | 4-5 hrs | Operational foundation |
8-10 | Create 3-tier pricing structure | 2 hrs | Revenue optimization |
11-14 | Claim and optimize GBP | 3 hrs | Local visibility |
15-20 | Build lead magnet + landing page | 4-5 hrs | Lead generation |
21-25 | Create onboarding workflow | 3 hrs | Client experience |
26-30 | Acquire first 5 clients (network) | Ongoing | Revenue begins |
Phase 2: Launch (Days 31-60)
Week | Focus | Key Actions |
|---|---|---|
5 | Content rhythm | Start 3x/week posting on primary platform |
6 | Email setup | Create 5-email welcome sequence |
7 | Proof collection | Document first transformations, request testimonials |
8 | Referral launch | Introduce referral program to first clients |
Target End of Day 60: 10-15 active clients, documented systems, content rhythm established.
Phase 3: Growth (Days 61-90)
Activity | Target Metric |
|---|---|
Scale marketing | 20+ leads/month |
Optimize retention | 85%+ month-over-month |
Refine pricing | Test higher tier pricing |
First automation | 3+ workflows running |
Client capacity | 15-20 active clients |
12-Month Growth Roadmap
Quarter | Theme | Focus Areas | Client Target |
|---|---|---|---|
Q1 | Launch and Learn | Foundation, first clients, iteration | 15-20 |
Q2 | Stabilize | Operations, retention, raise prices | 25-30 |
Q3 | Expand | Group/online, consider first hire | 35-45 |
Q4 | Scale | Team building, revenue diversification | 50+ |
Business Health Scorecard (Monthly Assessment)
Area | 1-2 (Struggling) | 3 (Functional) | 4-5 (Thriving) |
|---|---|---|---|
Acquisition | <3 new/month | 3-5 new/month | 6+ new/month |
Retention | <70% | 70-85% | 85%+ |
Revenue consistency | High variance | Moderate | Predictable MRR |
Operational efficiency | 20+ admin hrs | 10-20 hrs | <10 hrs |
Financial clarity | Don't know margins | Quarterly review | Real-time dashboard |
Technology utilization | Spreadsheets/manual | Basic platform | Fully integrated |
Work-life balance | Burned out | Managing | Sustainable |
Professional growth | Stagnant | Occasional learning | Continuous improvement |
Action Rules:
Score 1-2: Immediate intervention required
Score 3: Optimization opportunity
Score 4-5: Maintain and share best practices
Technology Adoption Sequence (Recommended)
Timeline | Priority | Investment | Expected Return |
|---|---|---|---|
Week 1-2 | Payment processing + basic scheduling | $0-30/mo | Stop leaving money on table |
Month 1-2 | Full program management platform | $50-120/mo | 133% capacity increase over 6 months |
Month 3-4 | Email marketing automation | $30-50/mo | 5-10x return on email investment |
Month 6+ | Advanced analytics + CRM integration | $50-100/mo | Predictive churn prevention |
Common Pitfalls to Avoid
Pitfall | Why It Is Dangerous | How to Prevent |
|---|---|---|
Underpricing | Signals low value, attracts difficult clients | Calculate minimum viable rate, test upward |
Over-delivering | Burnout, unsustainable expectations | Systematize, document, boundaries |
Ignoring finances | Operating blind, "month-end surprise" | Track 7 metrics monthly |
No niche | Competing on price with everyone | Specialize by Month 12 |
Manual everything | 15+ admin hours, capacity ceiling | Adopt platform by Month 2 |
Acquisition obsession | Ignoring retention = leaky bucket | 80% focus on keeping clients |
No boundaries | Work consumes life, resentment | Hard hours, 24-hr policy |
Skipping legal basics | Personal asset exposure | LLC + insurance by Week 1 |
Marketing only when not busy | Feast/famine cycle | Consistent marketing always |
Too much too fast | Overwhelm, nothing done well | Prioritize ruthlessly |
Case Studies and Success Stories
Case Study 1: Evans Armantrading (CNU Fit, Delaware)
Journey: Solo trainer (2009) to multi-location studio
Current Scale: Hundreds of clients, team of trainers
2024 Results: $580,000 net owner income
Key Strategies: Semi-private sessions, stretch therapy specialty, full software integration, data-driven management
Timeline: 15 years to current scale
Key Quote: "Your job is to lead, develop your team, and guide the ship, not do everything yourself."
Case Study 2: Matt Reynolds (Barbell Logic)
Starting Point: 135 clients via spreadsheets, 14-hour days
Intervention: Coaching platform adoption
Current Scale: 700+ clients, 20 coaches
Results: 94% retention rate, multi-million dollar enterprise
Timeline: 3-4 years to current scale
Key Learning: Admin reduced from 14 hours/day to 90 minutes/day
Case Study 3: TeamFFLEX
Background: New online coaching business
Scale Achieved: 6-figure business ($48,000/month) in under 1 year
Strategies: Systematized online delivery, automated communication, scalable templates
Key Learning: Technology infrastructure enables growth not possible with manual methods
Case Study 4: Mike Doehla (Stronger U Nutrition)
Business Type: Online nutrition coaching
Scale: $500K+/month revenue, 8-figure business
Key Metrics: NPS score of 78 (excellent satisfaction)
Strategies: Laser niche focus, exceptional client results, community-driven referrals
Key Learning: Niche domination + systems = exponential scale
Case studies compiled from publicly available interviews and platform testimonials. Individual results reflect specific market conditions, experience levels, and implementation quality. Results may vary.
Conclusion and Next Steps
Look, if you have read this far -- all 6,000+ words of it -- you are already different from most trainers. Most will skim the headlines and move on. The fact that you are still here tells me you are serious about building something that lasts. So here is the honest version of where things stand.
The personal training business landscape in 2026 offers significant opportunity for those willing to approach it as a real business, not just a job trading hours for dollars. But opportunity without execution is just potential, and this industry is littered with talented trainers who had all the potential in the world.
The Integration Formula
Sustainable success = Fitness expertise + Business systems + Technology leverage
No single element is sufficient:
Expertise alone leads to burnout (great trainer, terrible business)
Systems without expertise fail clients (efficient mediocrity)
Technology without both is expensive software gathering dust
The Competitive Advantage in Numbers
What Most Trainers Do | What Top Performers Do | The Gap |
|---|---|---|
18 clients (manual) | 42 clients (platform) | 133% capacity |
60% retention | 85-95% retention | 25-35 pts |
Unknown margins | 50-70% net margin | Profitability |
No tracking | 7 metrics monthly | Data-driven decisions |
Generalist positioning | Niche specialization | Premium pricing |
Burn out in 1-3 years | Sustainable 10+ year careers | Longevity |
Your Competitive Advantage
In a market of 329,000+ trainers, most:
Do not use technology effectively (or at all)
Do not track their numbers (operate on hope)
Do not systematize operations (reinvent daily)
Do not invest in business education (only certifications)
By implementing what is in this guide, you separate yourself from the vast majority. The 80% first-year attrition rate is not your destiny -- it is the competition eliminating itself.
Next Steps by Your Current Stage
New Trainers (0-10 clients):
Complete 90-day launch plan
Focus on first 15 clients + testimonials
Do not overcomplicate -- foundational systems first
Investment priority: Platform + insurance
Established Trainers (15-30 clients):
Implement full technology stack
Document SOPs for all recurring tasks
Optimize retention (it is cheaper than acquisition)
Decision: Scale via leverage (group/online) or premium (raise prices)
Scaling Trainers (30+ clients):
Consider first hire (VA then associate trainer)
Diversify revenue (group, corporate, digital)
Transition from working in to working on the business
Build the team and systems that do not require you
The Final Math
The difference between the trainers who make it and those who do not is not talent -- it is operational sophistication.
Trainer A (Manual Operations):
- 18 clients x $350/month = $6,300/month
- 60% retention = 4-5 month average tenure
- LTV: $6,300 x 4.5 = $28,350/year
- Works 50+ hours/week
- Exits industry in 2.5 years (average)
Trainer B (Technology-Enabled):
- 42 clients x $400/month = $16,800/month
- 85% retention = 10+ month average tenure
- LTV: $16,800 x 10 = $168,000/year
- Works 35-40 hours/week
- Builds sustainable 10+ year career
The tools, strategies, and systems in this guide create that gap.
Consult a healthcare professional before starting any new exercise or nutrition program. Consult a qualified accountant or attorney for tax and legal advice specific to your situation.
Ready to Transform Your Personal Training Business?
FitFlow provides the integrated platform that successful trainers use to:
Manage 2-3x more clients without additional admin time
Automate retention-driving touchpoints
Track the 7 metrics that matter in real-time
Deliver premium client experiences at scale
Start Your Free Trial | Book a Demo
Research Citations
IBISWorld Personal Trainers Industry Analysis 2025-2026 - Market size ($11.9B US), growth trends, 329,000+ trainers -- ibisworld.com
Health & Fitness Association (HFA) 2024 Report - 77 million U.S. gym memberships (record) -- healthandfitness.org
Bain & Company / Frederick Reichheld - 5% retention improvement = 25-95% profit increase -- bain.com
ACSM 2026 Worldwide Fitness Trends - Wearable technology #1 trend (8th time in 10 years) -- acsm.org
Wharton School of Business / Schmitt, Skiera, Van den Bulte - Referred customers: 16% higher LTV -- faculty.wharton.upenn.edu
Litmus 2025 State of Email Survey - Email ROI: $36-42 per $1 spent -- litmus.com
BusinessDojo Personal Training Profitability (2026) - Expense ratios, profit margins, retention statistics
SmartHealthClubs - Gym Retention Statistics (2026) - Member behavior, PT impact on retention
Trainerize Blog - Case Studies - Platform implementation success stories -- trainerize.com
Institute of Personal Trainers - Pricing Guide 2026 - Pricing benchmarks
TrueCoach Personal Trainer Burnout Study - Burnout statistics
ACE Industry Survey - First-year trainer attrition data
Expert Quotes Compilation
On Technology and Scaling:
"Personal trainer business apps allow you to scale efficiently without doubling your workload. They are not optional anymore -- they are a must-have if you want to compete and thrive in 2026." -- Trainerize
"Without TrueCoach, there is no way I would be able to grow." -- Matt Reynolds, Founder of Barbell Logic (Scaled to 700+ clients)
On Business Operations:
"Business should run on numbers, not emotion. Use data to make fast decisions and coach your team with data." -- Evans Armantrading, CEO of CNU Fit ($580K net income)
On Retention:
"Boosting client retention by 5% can increase profits by 25% to 95%." -- Bain & Company
On Marketing:
"The goal is not for you to find your clients. The goal should be that the clients find you." -- William "Wolf of PT" (300+ clients, $5M sales)
On Profit Margins:
"Trainers who carefully track and optimize expenses can maintain profit margins of 50-70%, while those with poor financial management may see margins shrink to 20-30%." -- BusinessDojo
Published by FitFlow Research Team | March 2026
Word Count: approximately 5,200 words | Reading Time: approximately 21 minutes