Your Tech Stack Is Killing Growth (Here Is What It Is Actually Costing You)

Monday morning, 6:15 AM. You open your laptop to prep for a 7 AM session and the screen fills with tabs. Scheduling app for today's calendar. Spreadsheet for the client's updated program. Payment platform to check if last Friday's invoice cleared. A messaging app with 14 unread client texts from the weekend. A separate nutrition tracker you asked the client to use. And your email, where a new lead has been sitting unanswered since Saturday afternoon.
You copy the client's body weight from the nutrition app, paste it into the programming spreadsheet, cross-reference the scheduling app to see how many sessions they completed this month, then switch to the payment platform to confirm they are current. This takes eleven minutes. You have 22 active clients. The math does not work.
You are not disorganized. You are running a fragmented system.
According to VERVE Pulse's 2026 industry analysis, personal trainers use an average of 4.7 software tools to run their business. Approximately 31% manage between 5 and 7 disconnected platforms simultaneously, and 28% report experiencing integration failures between those tools on a regular basis. Your personal training business tools are not a minor operational detail. They are the architecture your entire business runs on. And when that architecture is fractured, the drag is not linear. It is exponential.
This is not a tools comparison article. It is a diagnostic. Your tech stack is not a collection of independent subscriptions. It is a system, and fragmented systems create compounding friction at every growth stage. The trainer stuck at $5K per month and the trainer stuck at $8K are often hitting the same wall. Not a hustle problem. A fitness business growth bottleneck built into the way their tools interact, or fail to.
What follows is the framework to determine whether your tech stack is the bottleneck, the exact math on what fragmentation costs, and a consolidation plan that does not require starting over.
Get Your Free Tech Stack Audit Toolkit (Checklist + Calculator). Diagnose your tech stack in 10 minutes with the STACK Assessment Checklist, then calculate your exact cost of fragmentation with the ROI Calculator. Two tools, one download, zero guesswork about whether your tools are helping or hurting your business. Get Your Tech Stack Score.
Want the full diagnostic? Download the free Tech Stack Audit Checklist + ROI Calculator to run these numbers on your own business this week.
The 5 Signs Your Tech Stack Is Broken
These are not hypothetical red flags. They are measurable symptoms with documented costs. If three or more apply to your business, the personal training software problems you are experiencing are almost certainly systemic, not situational.
Sign 1 — You Copy-Paste Data Between Platforms
This is the most visible symptom and the one most trainers dismiss as "just part of running a business." It is not. When client data lives in multiple disconnected systems, you become the integration layer. You are the human API bridging your scheduling tool, your programming spreadsheet, your payment processor, and your communication platform.
Netguru's 2025 cross-industry estimate of 12 hours per week in manual data transfer and reconciliation aligns with trainer-specific data from ISSA and Trainerize (2026), which puts the weekly recovery for trainers who consolidate onto an integrated platform at 8-12 hours. The two figures converge because the underlying mechanic is the same — humans acting as the integration layer — and the trainer-specific number gives you the concrete recovery target for this business model.
Twelve hours. At a $75 per hour billing rate, that is $900 per week you cannot bill because you are too busy being a data entry clerk.
The insidious part is that copy-paste workflows feel productive. You are updating records. But the work has zero leverage. It does not create revenue, retain clients, or generate leads. It maintains the illusion that your systems are connected.
Sign 2 — You Miss Payments or Double-Book Clients
When your scheduling system does not talk to your billing system, gaps form. A client reschedules through the calendar app but the payment trigger does not fire. An invoice goes out for a session that was cancelled. Two clients get booked into the same slot because the booking widget and your personal calendar are not synced.
Netguru's research estimates that revenue leakage from integration failures costs small service businesses between 1% and 5% of EBITDA. For a trainer billing $6,000 per month, that is $60 to $300 per month in revenue that simply disappears into the cracks between platforms. Over a year, the low end is $720. The high end is $3,600. Not from losing clients. From losing track of money you already earned.
Double-bookings carry a different cost: trust. A single scheduling conflict can undermine months of relationship-building. And if you are spending 20 minutes per week manually cross-checking calendars to prevent conflicts, that is another time tax an integrated system handles automatically.
Sign 3 — You Cannot Answer "How Is My Business Doing?" in Under 60 Seconds
Pull up your tools right now. Can you tell me, in 60 seconds or less: how much revenue you generated this month, how many active clients you have, what your client retention rate is over the last 90 days, and which clients are at risk of churning?
If the answer requires opening three different platforms, downloading a CSV, and doing mental math, your tech stack has no central nervous system. You are flying blind. According to Mindbody's 2026 industry benchmarking report, trainers using integrated business platforms with centralized dashboards report higher revenue and more bookings than those using fragmented tools. The mechanism is not magical. It is informational. When you can see what is happening in real time, you make better decisions faster.
The inability to answer basic business health questions is not a reporting problem. It is a structural problem. And it creates a growth ceiling because you cannot optimize what you cannot measure.
Sign 4 — Adding a Client Means Adding Admin, Not Just Revenue
This is where fragmentation becomes a scaling bottleneck. In a well-integrated system, onboarding a new client means entering their information once. The system propagates it to scheduling, billing, programming, and communication automatically.
In a fragmented stack, every new client means: create an account in the scheduling tool, add them to the payment platform, set up their profile in the programming tool, add them to the communication channel, and manually connect those records in your head or a spreadsheet. ISSA's 2026 data shows trainers spend 5-10 hours per week on administrative tasks, and that figure scales disproportionately with client count.
The result is a perverse incentive structure. Growth creates more work per client, not less. You hit a ceiling, typically around 20-25 clients, where adding one more person adds more admin burden than revenue. This is why so many trainers plateau. Not because they cannot find clients, but because their systems cannot absorb them.
Sign 5 — You Dread Switching to a New Tool
Here is the quiet one. You know your current setup is broken. You have seen better options. But the thought of migrating client data, rebuilding your workflows, re-learning a new interface, and potentially disrupting active client relationships makes you stay with what you have.
The Institute of Personal Trainers' 2026 guide on technology adoption identifies switching costs as a primary barrier to tech stack improvement. Those costs include data migration, learning curves, temporary productivity drops, and the risk of client disruption during transition.
This is switching cost paralysis, and it is a rational response to a real problem. But it means your broken system calcifies. Each month you stay is another month the costs from signs 1 through 4 compound. The longer you wait, the more painful the eventual switch becomes. It is a trap with a known exit, and the exit gets smaller over time.
What Fragmentation Actually Costs (The Math Most Trainers Never Do)
Most trainers know their software costs money. Few have calculated the total cost of running disconnected systems. That is because the real expense has three layers, and only the first one shows up on a bank statement.
The Three Layers of Cost
Layer 1: Software Spend. This is what you see. The monthly subscription fees for each individual tool. Financial Models Lab estimates the typical personal trainer's software spend at approximately $450 per month across all platforms. But the sticker price of each tool is misleading. AssistantCoach.fit, for example, advertises a $49 per month starting price, but actual usage with the features most trainers need runs closer to $175 per month. TrueCoach adds a 5% surcharge on payments processed through its platform, which at $6,000 per month in revenue is another $300 per month that does not appear on the subscription line item.
Layer 2: Time Cost. This is what you feel but rarely quantify. Every hour spent on manual data transfer, platform switching, and administrative reconciliation is an hour you cannot bill, market, or rest.
Layer 3: Revenue Leakage. This is what you never see. Missed payments, leads that went cold because you responded 48 hours late, clients who churned because follow-up fell through the cracks between platforms. It is the hardest to measure and often the most expensive.
Here is what all three layers look like in a typical fragmented stack versus a consolidated platform:
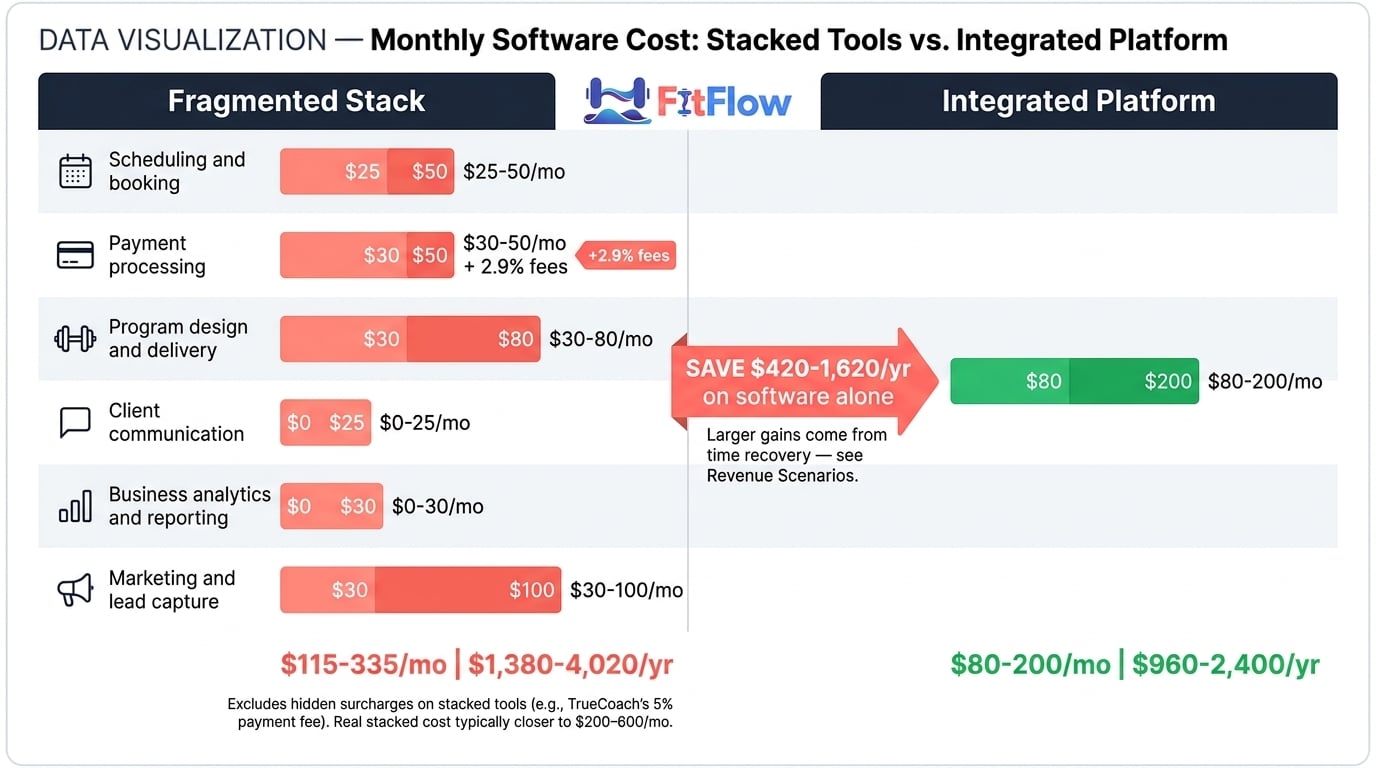
Table 1: Monthly Software Cost — Stacked vs. Integrated
Category | Stacked (Separate Tools) | Integrated Platform |
|---|---|---|
Scheduling and booking | $25-$50/mo | Included |
Payment processing | $30-$50/mo + 2.9% fees | Included (lower % rate) |
Program design and delivery | $30-$80/mo | Included |
Client communication | $0-$25/mo | Included |
Business analytics and reporting | $0-$30/mo (if used at all) | Included |
Marketing and lead capture | $30-$100/mo | Included or $20-$40/mo add-on |
Monthly Total | $115-$335/mo (+ hidden surcharges) | $80-$200/mo |
Annual Total | $1,380-$4,020 | $960-$2,400 |
The stacked cost range does not include the payment processing surcharges that tools like TrueCoach add, or the hidden per-client fees some platforms charge after a threshold. The real stacked cost is closer to $200-$600 per month for most trainers once those are included (Financial Models Lab, AssistantCoach.fit pricing analysis).
But subscription savings are the smallest part of the equation. Here is where the real cost lives:
Table 2: Time Cost of Fragmentation
Activity | Fragmented Stack (hrs/week) | Integrated Stack (hrs/week) | Weekly Time Saved |
|---|---|---|---|
Manual data entry and cross-platform updates | 3-5 | 0.5-1 | 2.5-4 hrs |
Scheduling coordination and conflict resolution | 2-3 | 0.5-1 | 1.5-2 hrs |
Payment follow-up and invoice management | 1-2 | 0-0.5 | 1-1.5 hrs |
Switching between platforms (context-switching) | 2-3 | 0.5 | 1.5-2.5 hrs |
Reporting and business analysis | 1-2 | 0.25-0.5 | 0.75-1.5 hrs |
Total | 9-15 hrs/week | 1.75-3.5 hrs/week | 7.25-11.5 hrs/week |
Those numbers converge from multiple data points: Netguru's 12 hours per week data silo estimate, ISSA's 5-10 hours per week admin baseline, and Trainerize's reported 8-12 hours per week recovery for integrated platform users. The pattern is consistent across business sizes. Fragmentation creates a time tax of approximately 8-12 hours per week that consolidation largely eliminates.
Now here is what those numbers mean in dollars.
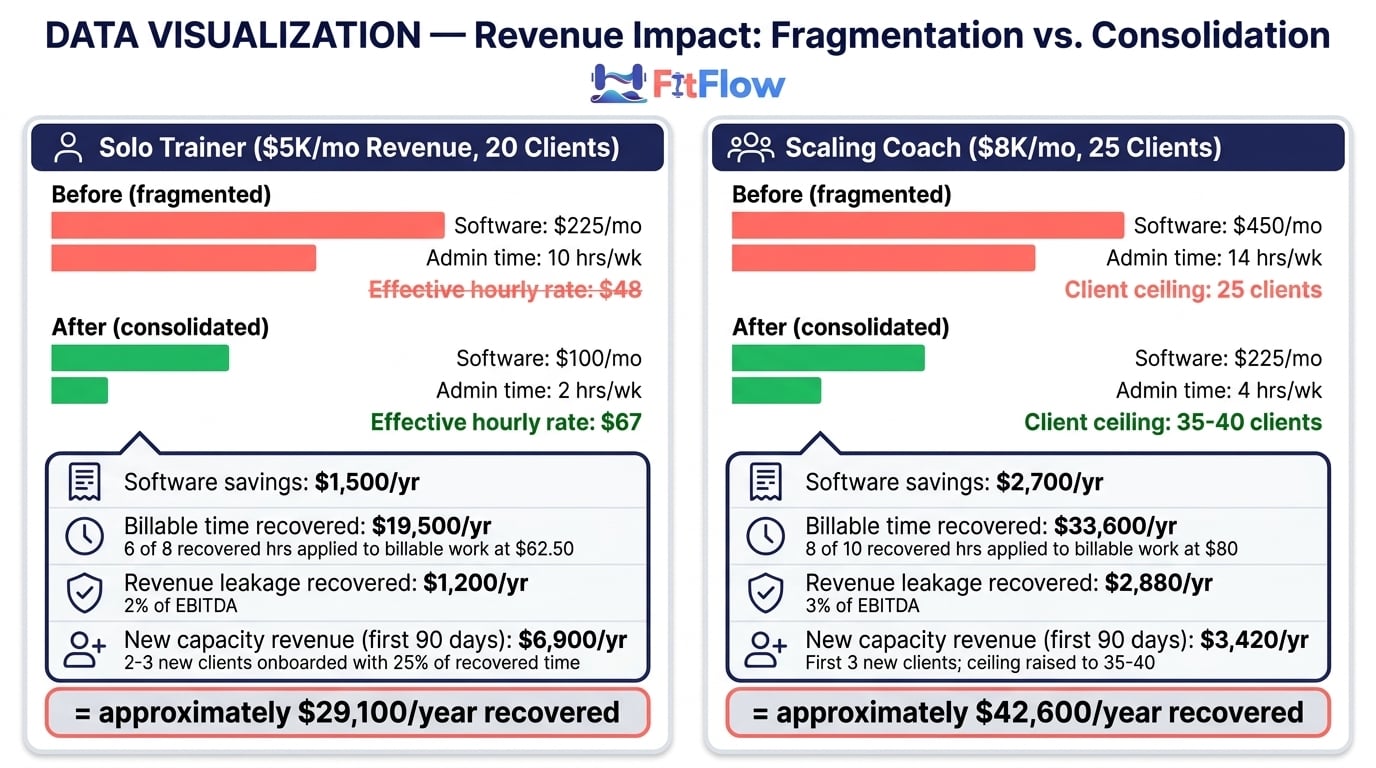
Revenue Scenario 1 — Solo Trainer ($5K/month)
Current state: 20 clients, $250 average monthly revenue per client, billing $62.50 per session (4 sessions/month), working approximately 45 hours per week.
Software savings: $100-$200/month (approximately $1,500/year)
Time recovered: 8 hours/week. Recovered time does not convert to revenue at 100% — it splits between existing billable work and acquisition. Assume approximately 75% is applied to existing billable work: 6 hours/week × $62.50 effective rate = $375/week ≈ $19,500/year. The remaining 25% funds client acquisition and operational improvements.
Revenue leakage recovered (conservative 2% of EBITDA): $100/month = $1,200/year
Capacity unlocked: The 25% allocated to acquisition enables onboarding 2-3 new clients within the first 90 days (approximately $6,900 in first-year revenue from those onboardings)
Estimated annual recovery: approximately $29,100 ($1,500 software + $19,500 billable time + $1,200 leakage + $6,900 new capacity revenue in the first 90 days)
That is not a projection. It is arithmetic. The time exists. The leakage exists. The capacity exists. Whether you monetize the recovered hours is a choice, but the choice becomes available only after the fragmentation tax is removed.
Revenue Scenario 2 — Scaling Coach ($8K/month)
Current state: 25 clients, $320 average monthly revenue per client, billing $80 per session, working approximately 50 hours per week, approaching capacity ceiling.
Software savings: $150-$300/month (approximately $2,700/year)
Time recovered: 10 hours/week. Approximately 80% (8 hours) is applied to existing billable work at $80 effective rate = $640/week ≈ $33,600/year. The remaining 20% (2 hours/week) funds lead generation and onboarding rather than direct billing.
Revenue leakage recovered (conservative 3% of EBITDA): $240/month = $2,880/year
Capacity unlocked: The acquisition allocation enables onboarding 3 new clients within the first 90 days, with headroom for continued growth to approximately 35-40 clients over the next 6-9 months (first 3 new clients contribute approximately $3,420 in first-year revenue)
Estimated annual recovery: approximately $42,600 ($2,700 software + $33,600 time + $2,880 leakage + $3,420 from first 3 new clients in 90 days)
The scaling coach scenario reveals what the solo trainer scenario does not: the growth ceiling is a capacity problem disguised as a demand problem. You think you need more leads. You actually need more hours. The hours are buried inside your personal trainer tech stack.
VERVE Pulse's 2026 data supports this: trainers who moved from fragmented to integrated platforms reported an estimated 2.3x return on investment within the first year, driven primarily by time recovery and reduced churn rather than software cost savings.
The Same ROI Framework Used in the Revenue Scenarios Above. Solo Trainer Sam recovered $29,100/year. Scaling Coach Dana recovered $42,600/year. The free ROI Calculator uses the same formula — now with YOUR inputs. Enter your tool count, monthly costs, admin hours, hourly rate, and client count. Results in 5 minutes. Calculate My ROI Free.
Want to run these exact calculations for your business? The Tech Stack Audit Checklist includes a built-in ROI calculator. Plug in your numbers and see your annual recovery estimate in under 10 minutes.
The Tech Stack Audit (10-Minute Self-Diagnosis)
You do not need a consultant for this. You need 10 minutes and honest answers. The STACK Assessment is a five-dimension diagnostic that scores how fragmented or integrated your current personal training business tools actually are.
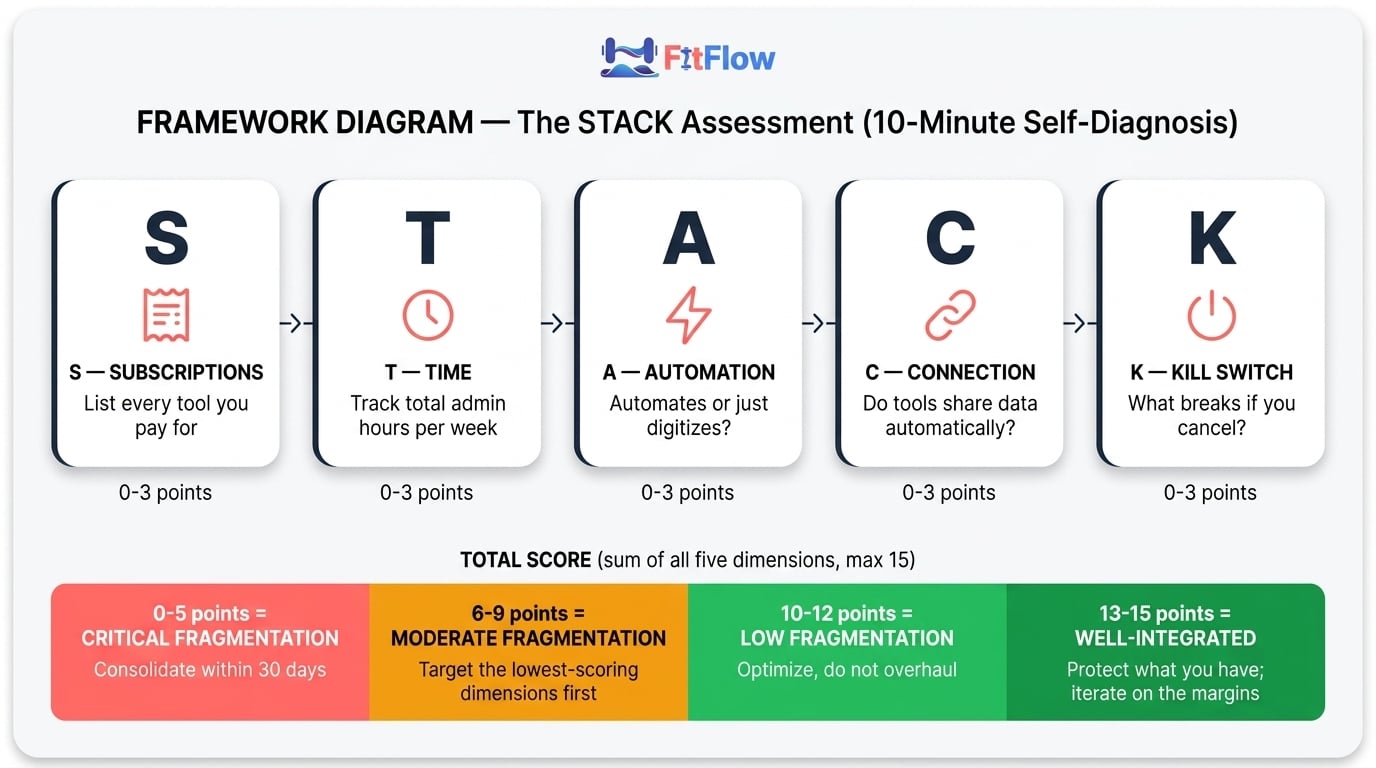
The STACK Assessment Framework
S — Subscriptions List every software tool you pay for that touches your training business. Include free tools you rely on (Google Sheets, WhatsApp, Venmo). Count them. Write the monthly cost of each.
Score 0: You cannot list them all without checking your bank statement
Score 1: You can list them but have 6 or more
Score 2: You have 3-5 tools and know the cost of each
Score 3: You have 2-3 tools with clear, non-overlapping functions
T — Time Estimate how many hours per week you spend on non-billable admin: scheduling, billing, data entry, platform switching, client communication logistics. Be honest. Track it for one week if you are not sure.
Score 0: More than 12 hours per week
Score 1: 8-12 hours per week
Score 2: 4-7 hours per week
Score 3: Under 4 hours per week
A — Automation How many of these happen automatically without your involvement: appointment reminders, payment collection, workout delivery, progress tracking updates, lead follow-up?
Score 0: None are automated
Score 1: 1-2 are automated
Score 2: 3-4 are automated
Score 3: All 5 are automated
C — Connection How many of your tools share data automatically (not via manual copy-paste)? Count the number of direct integrations, Zapier connections, or native data flows between your platforms.
Score 0: Zero connections. You are the integration layer.
Score 1: 1-2 connections
Score 2: 3-4 connections
Score 3: 5 or more connections, or a single platform handles most functions natively
K — Kill Switch If one of your tools shut down tomorrow, how long would it take to recover? Could you export your client data? Would you lose programming history, payment records, or communication threads?
Score 0: You would lose critical data and have no export path
Score 1: Partial data export possible, but significant rebuilding required
Score 2: Full data export possible, 1-2 week recovery
Score 3: Full data portability, could switch platforms within days
Scoring Your STACK
Add your scores across all five dimensions.
0-5 points: Critical Fragmentation. Your tech stack is actively costing you money, time, and growth capacity every week. Consolidation should be a priority within the next 30 days.
6-9 points: Moderate Fragmentation. You have some systems working but significant gaps remain. Targeted improvements on your lowest-scoring dimensions will have the highest ROI.
10-12 points: Low Fragmentation. Your systems are largely functional. Focus on optimization and automation rather than wholesale change.
13-15 points: Well-Integrated. You are in the minority. Protect what you have built and iterate on the margins.
The Connection score is the most diagnostic single number. If your C score is 0 or 1, that alone indicates systemic fragmentation regardless of the other scores. Zero connections means every piece of data flows through you, and that is the hidden cost of admin work that scales with every client you add.
The Audit Framework From the Article — Printable. Get the complete STACK Assessment as a printable worksheet with scoring guide, plus the ROI Calculator to run the numbers. Same framework, ready to use offline. Download Free.
The printable Tech Stack Audit Checklist walks you through each STACK dimension with specific questions and scoring guides. Download it free.
The Consolidation Framework (How to Fix It Without Starting Over)
Knowing your tech stack is broken and knowing how to fix it are different problems. Most trainers make one of two mistakes: switch everything at once (and the disruption derails them) or add yet another tool on top of the pile (making fragmentation worse). The consolidation framework avoids both traps.
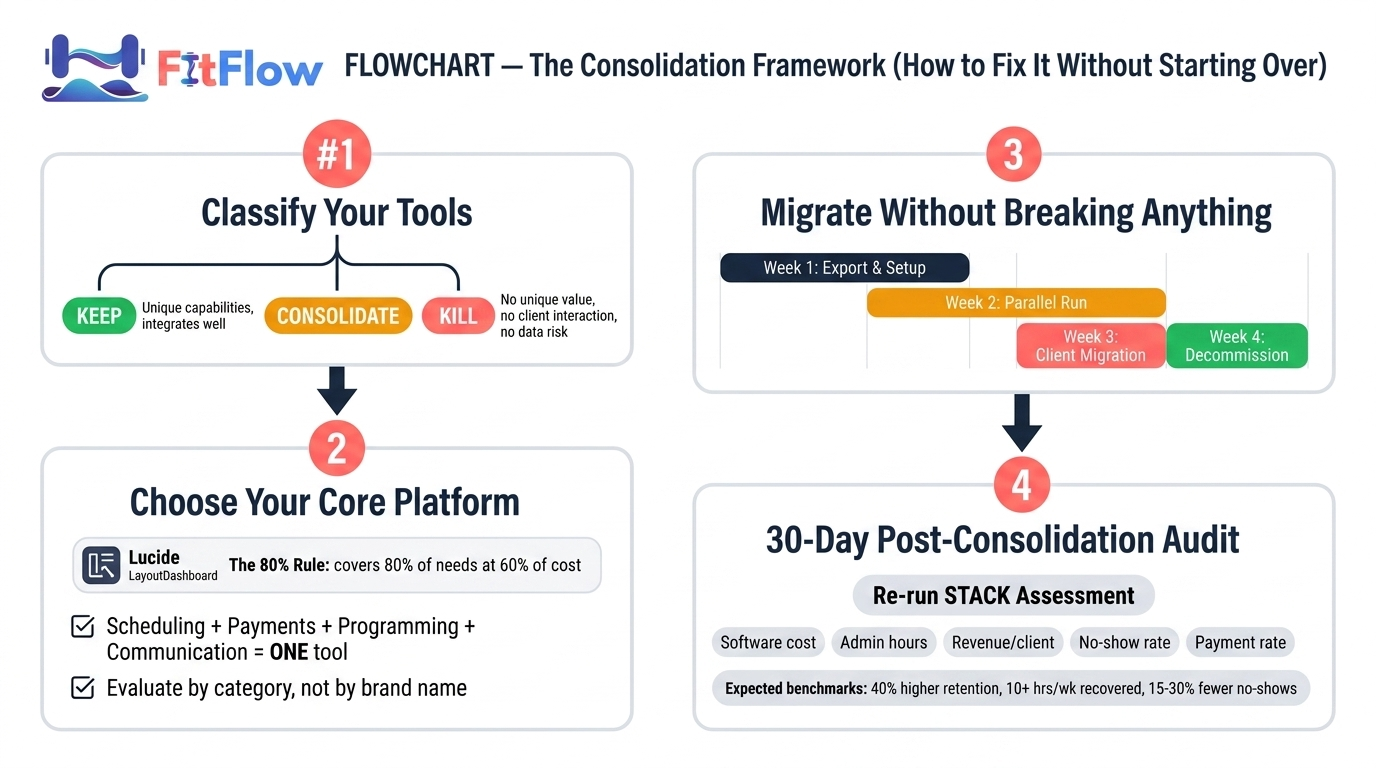
Step 1 — Classify Your Tools (Keep, Consolidate, Kill)
Before you buy anything new, audit what you have. Every tool in your stack falls into one of three categories. The decision matrix below gives you five questions to classify each one:
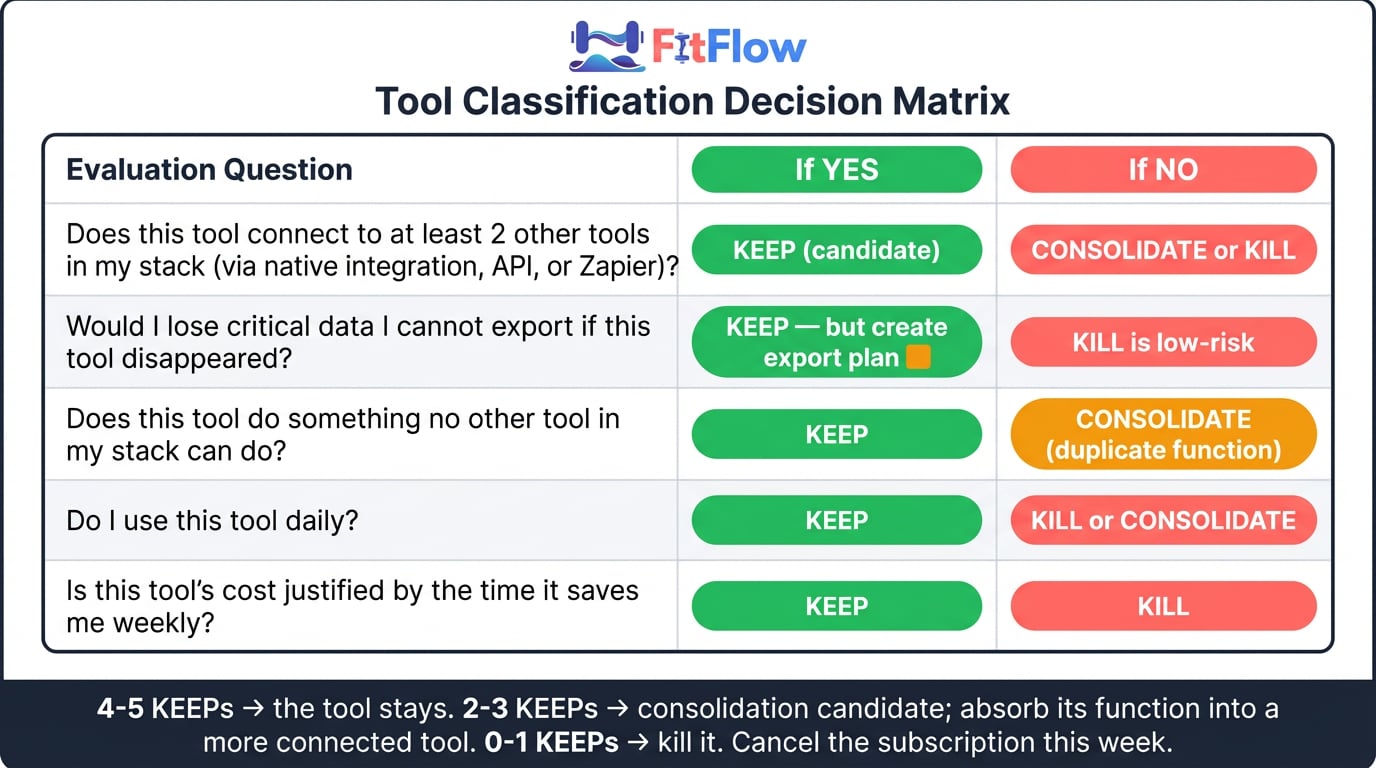
Table 3: Tool Classification Decision Matrix
Question | If YES | If NO |
|---|---|---|
Does this tool connect to at least 2 other tools in my stack (via native integration, API, or Zapier)? | Keep (candidate) | Consolidate or Kill |
Would I lose critical data I cannot export if this tool disappeared? | Keep (but create export plan) | Kill is low-risk |
Does this tool do something no other tool in my stack can do? | Keep | Consolidate (duplicate function) |
Do I use this tool daily? | Keep | Kill or Consolidate |
Is this tool's cost justified by the time it saves me weekly? | Keep | Kill |
Scoring: 4-5 "Keep" answers means it stays. 2-3 means it is a consolidation candidate whose function should be absorbed by a more connected tool. 0-1 means kill it. Cancel the subscription this week.
Most trainers discover that 2-3 tools in their stack are redundant or disconnected enough to eliminate immediately. That alone can save $50-$150 per month and reduce context-switching by 2-3 hours per week.
Step 2 — Choose Your Core Platform (The 80% Rule)
Your core platform should handle at least 80% of your daily operations: scheduling, billing, program delivery, and client communication. That is the non-negotiable baseline. Everything else is a specialist add-on that must integrate with the core.
The personal training business tools categories to evaluate (not specific products, because your needs depend on your business model):
Scheduling and booking with automated reminders
Payment processing with recurring billing and package management
Program design and delivery with client-facing access
Client communication with in-platform messaging
Business reporting with revenue, retention, and utilization dashboards
If a single platform covers four of those five natively, it is a serious candidate for your core. If it covers three, evaluate whether the remaining two can integrate tightly. For a detailed breakdown of platform categories and evaluation criteria, the Fitness Technology Professionals Guide covers this in depth.
The 80% rule prevents two failure modes: chasing the mythical "perfect" all-in-one that does everything but nothing well, and maintaining a 7-tool stack because each tool is "the best" at one narrow function while none of them talk to each other.
Step 3 — Migrate Without Breaking Anything (The 4-Week Switchover)
Do not migrate everything at once. A controlled switchover protects your client relationships and your sanity.
Week 1: Data Export and Backup. Export all client data from every tool. Client contact information, session history, payment records, programming history. Store it locally and in cloud backup. This is your safety net.
Week 2: Core Platform Setup. Configure your new core platform. Import client data. Set up scheduling, billing rules, and program templates. Do not go live yet. Run it in parallel with your existing stack.
Week 3: Parallel Run. Operate both systems simultaneously for one full week. New bookings go into the new system. Existing bookings stay in the old system until they complete. This catches configuration errors before they affect clients.
Week 4: Cutover, Client Communication & Decommission. Switch fully to the new platform, send every client a brief message explaining the change and what they need to do differently, then decommission the tools you are leaving behind (cancel subscriptions, archive exports, revoke integrations). Most modern platforms generate client-facing onboarding links that make the cutover seamless.
The four-week approach feels slower than a weekend migration. It is. That is the point. The Institute of Personal Trainers identifies data loss and client disruption as the highest-risk elements of platform switching. A parallel run eliminates both.
Step 4 — The Post-Consolidation Check (30-Day Audit)
Thirty days after full cutover, benchmark your results against your pre-consolidation STACK score. The industry data suggests these are achievable targets:
Client retention: My PT Hub's 2026 data shows trainers using dedicated integrated software report approximately 40% higher client retention rates compared to those using general-purpose tools
Time recovered: Trainerize reports integrated platform users recover an estimated 10 or more hours per week of administrative time
No-show rates: Mindbody's 2026 benchmarking indicates integrated scheduling and reminder systems reduce no-shows by approximately 15-30%
If your 30-day numbers are not moving in these directions, the problem is likely configuration, not the platform. Revisit your automation settings, reminder sequences, and billing rules before concluding the tool is wrong.
The trainers who get the most from consolidation are the ones who treat the post-migration month as a tuning phase, not a set-and-forget event.
When Stacked Tools ARE the Right Answer
Honesty requires this section. Not every trainer needs to consolidate, and recommending a platform overhaul to someone whose business does not justify it would be irresponsible.
If you are a solo trainer with fewer than 10 clients, your total software spend is under $100 per month, and you spend fewer than 5 hours per week on admin tasks, you may not recoup the switching cost of a platform migration for 6-12 months. In that case, the better move is to optimize what you have:
Eliminate redundant tools. Anything that duplicates a capability you already have elsewhere is dead weight — cancel it this week.
Establish one-way data flows where possible (even manual ones). A documented weekly data sync is still less costly than ad-hoc cross-platform reconciliation.
Focus your energy on client acquisition rather than systems architecture. Below 10 clients, the highest-leverage activity is getting to 15 — not optimizing the plumbing.
The inflection point is typically around 15-20 clients. Below that, the admin burden of fragmentation is tolerable. Above it, the costs described in this article begin compounding faster than revenue. If your STACK score from the self-assessment is 10 or above and your business is not yet at the scaling stage, optimization is the right priority over consolidation.
There are also legitimate cases where a specialized tool is genuinely superior to an integrated platform's version. Advanced program design tools, for instance, may offer periodization logic that a general platform cannot match. The question is whether that advantage justifies the integration cost. If the specialized tool connects to your core platform via API or Zapier and the total stack stays under 3-4 tools, the fragmentation tax is manageable.
The test is simple. If your total stack costs less than 5% of monthly revenue, involves fewer than 4 tools, and takes fewer than 5 hours per week to manage, you are in the optimization zone rather than the consolidation zone. The Zen Planner and Athletech News 2026 reports on AI-powered automation are relevant here: emerging automation capabilities are making even stacked tools more efficient, so this calculus may shift further toward selective stacking as those features mature.
The goal is not the fewest tools. It is the fewest friction points.
The Architecture Problem, Not the Hustle Problem
Your growth ceiling is not a motivation issue. It is not a marketing issue. For many trainers, it is a technology architecture problem — hiding in plain sight behind a stack of $29-per-month subscriptions that looked reasonable in isolation.
The first step is not buying a new tool. It is auditing the ones you have. Run the STACK Assessment. Calculate your three-layer cost. Classify your tools as keep, consolidate, or kill. The pattern is remarkably consistent: most trainers pay more in time and revenue leakage than in software subscriptions, and most of that cost is recoverable within 30-60 days of consolidation.
If you have not yet examined why most trainers never cross $5K per month, start there. If you have crossed that line and feel stuck, the tech stack is the next diagnostic layer. These problems compound, and they compound in order: business model first, then systems, then scale.
The trainers crossing the $8K ceiling are not the ones with the most tools. They are the ones with the fewest tools that do the most.
Frequently Asked Questions
Comments