Most Trainers Track the Wrong Metrics. Here's What to Track Instead

Your client has attended 23 of the last 24 sessions. The bench press on her log is five pounds heavier than it was eight weeks ago. By any reasonable measure, the program is working. And yet at last week's check-in she looked at you and said, "I don't feel like I'm getting anywhere." You pulled up her log. Weight up. Attendance perfect. The numbers say progress. She says stall. One of you is reading the wrong dashboard.
You were tracking two things -- attendance and load -- that both looked fine. You were not tracking the seven things that would have flagged this plateau three weeks ago: her adherence to the prescription, her set-rep completion at the prescribed RIR, her volume-load trend per muscle group, her RIR drift across the block, her planned-vs-actual RPE, her recovery markers, and her form consistency under load. The signal was there. You were not listening for it.
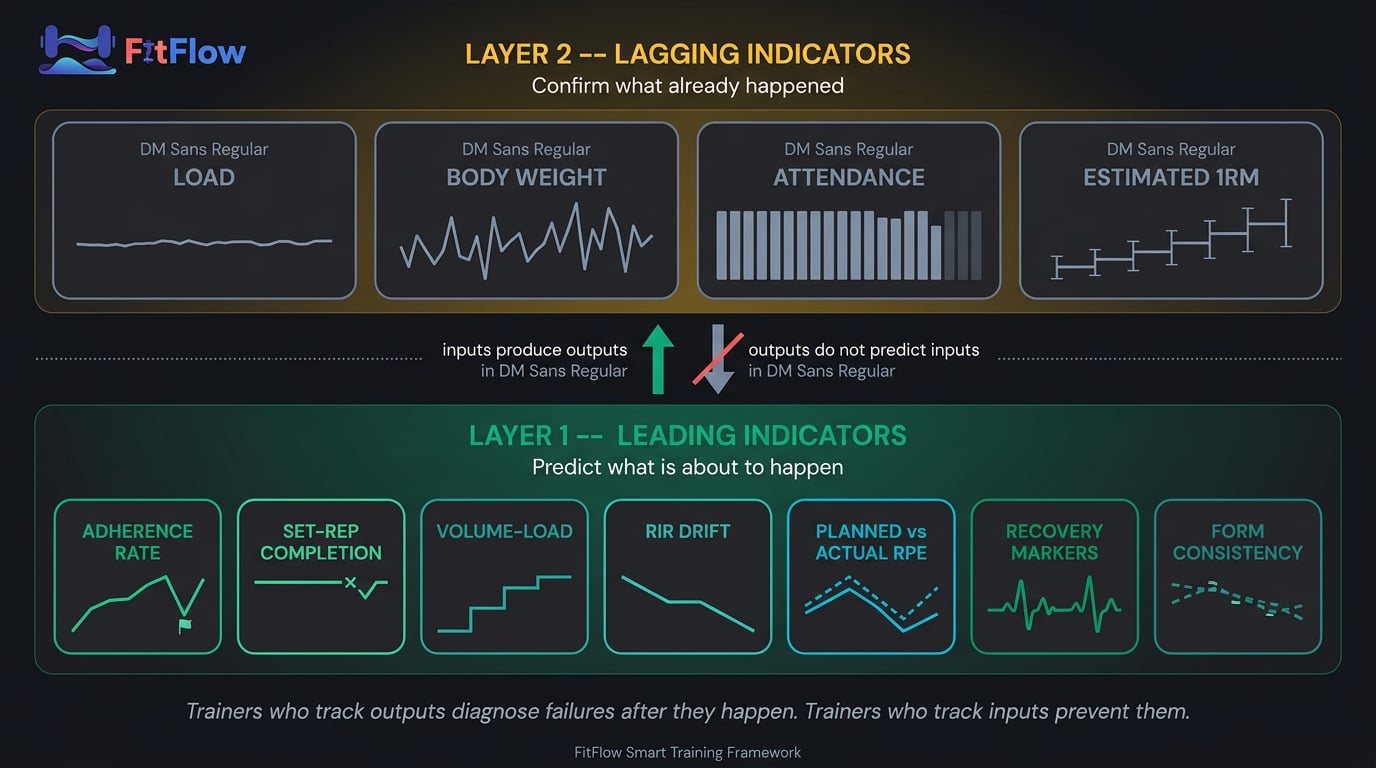
Most trainers track the wrong metrics. Not because they track too little, but because they track the wrong layer of the system. Weight on the bar, body weight, session attendance, 1RM estimates -- these are outputs. They tell you what already happened. They cannot tell you whether adaptation is occurring, plateauing, or about to stall. The inputs that predict those outputs live one layer underneath. Trainers who track outputs diagnose failures after they happen. Trainers who track inputs prevent them.
We built the Metrics Decision Matrix — a free practitioner checklist that maps the 7 input metrics to training age, goal, and client segment. One lookup tells you which inputs to track and at what cadence for every client on your roster. Download it free at the bottom of this article .
The ACSM 2026 Resistance Training Position Stand confirmed what the research has been showing for a decade: effort management (RIR), total volume, and proximity-to-failure are the primary drivers of adaptation, not load alone Lees et al., 2026. The IHRSA 2025-2026 Global Industry Report confirmed the parallel truth on retention: personal training retains at roughly 80% versus 60-66% for general membership, and the premium is driven by measurement infrastructure, not programming IHRSA, 2026. The trainers who retain clients are not running better programs. They are tracking the inputs that let them intervene before the plateau becomes a cancellation.
Two related questions are addressed elsewhere on this site. Prioritization -- which training variables drive most of the outcome -- is handled in The 80/20 of Training Results. Diagnosis -- which failure mode is causing a specific plateau -- is in Why Your Clients Are Not Progressing. This post answers a different question: which measurements reveal, continuously, whether any variable is working or any failure mode is in play. Prioritization, diagnosis, measurement. This one is the measurement instrument.
The Metrics Trap
Trainers do not track the wrong metrics because they lack options. They track them because they are easier to measure, easier to graph, and easier to communicate. The trap is not ignorance. It is convenience.
Why Easy Metrics Dominate Trainer Dashboards
Three structural forces push trainer dashboards toward the wrong layer.
The first is cognitive ease. Load produces a yes/no answer the trainer can show the client without interpretation. RIR drift requires judgment. Volume-load requires math. Adherence requires a comparison between prescription and execution. The cognitive cost differential between the easy metric and the informative one shapes what gets measured week after week.
The second is CRM-friendly data. Most trainer software stacks ship with built-in fields for load, reps, sets, and attendance. They do not ship with fields for "RIR on set 3 of the leg press" or "did the client hit the prescription at the prescribed effort?" Data that is structurally easy to capture becomes data that gets captured. This is a structural bias toward aggregatable data, and aggregatable data is output data.
The third is tool defaults. The default dashboard view across every major platform is some variant of total sessions, total volume, and top lifts. Those defaults reflect what is easy to aggregate at the platform level, not what is informative at the client level. The thing the dashboard shows is the thing the trainer defends.
Easy-to-measure metrics dominate trainer dashboards because they are unambiguous, CRM-friendly, and built into default software views. Harder-to-measure input metrics predict progress but require trainer judgment and custom tracking.
The 4 Output Metrics That Mislead
Four output metrics dominate the modern trainer dashboard. None of them are wrong. All of them are lagging.
Load (weight on the bar) alone. Load is an output of coordinated input variables: form quality, RIR management, volume-load progression, recovery. When load goes up, it can mean adaptation. It can also mean the client is grinding reps with degraded form at 0 RIR while carrying accumulated fatigue. Without a companion RIR or form metric, load does not tell you whether the number is healthy progress or compensated failure. Helms and colleagues demonstrated that fixed-load prescription produces outcomes equivalent to or worse than effort-regulated prescription Helms et al., 2018.
Body weight (scale weight) alone. Scale weight moves with hydration, sodium, glycogen, menstrual cycle, and recent bowel movements before it moves with body composition. Weekly fluctuations of 1-3 kg are biologically normal and have nothing to do with training response. Weekly scale weight is a mood regulator, not a decision variable.
Session attendance alone. A client can attend 23 of 24 sessions, miss 30% of the prescribed reps, work at 5 RIR instead of the prescribed 2 RIR, and never complete a full set at the prescribed tempo. Attendance confirms presence. It does not confirm adherence. PT Distinction's 2026 industry research identified training-load completion -- not attendance -- as the stronger adherence predictor, alongside recovery-readiness and sleep quality PT Distinction, 2026.
Estimated 1RM. 1RM estimators (Epley, Brzycki, Lombardi, Wathan) are mathematical projections from sub-maximal performance with error bands of 5-15%, widening with rep count LeSuer et al., 1997. A 1RM that "went up 10 lb" from a 5-rep estimate is often within the noise band of the estimator itself. Useful cross-check, poor primary progress metric.
These metrics confirm outcomes after they happen. The thesis is not stop tracking load. It is do not use load as your primary progress signal. Load is the receipt. Inputs are the transaction.
Output vs. Input: The Metric Layer Problem
Every training metric belongs to one of two layers. Layer 1 metrics are leading indicators -- they describe the inputs to adaptation and move before outcomes change. Layer 2 metrics are lagging indicators -- they describe the outcomes and move after the fact. Both layers are real measurements. The problem is that most trainer dashboards measure Layer 2 almost exclusively and assume the Layer 1 inputs are taking care of themselves.
Personal trainers should track two layers. Layer 1 (leading indicators, inputs) predicts progress: adherence rate, set-rep completion at target RIR, volume-load per muscle group, RIR drift, planned-vs-actual RPE, recovery markers, and form consistency. Layer 2 (lagging indicators, outputs) confirms results after the fact: load lifted, body weight, attendance, and 1RM estimates. Leading indicators let trainers intervene before plateaus. Lagging indicators only describe what already happened.
Why Inputs Predict Outputs
Adaptation is a dose-response phenomenon. The body adapts to the dose it actually receives, not the dose the trainer intended to deliver. The dose is the input. The output is the adaptation the dose produces. If the dose is wrong -- too little, too much, too recoverable, too far from failure -- the output will not materialize. The output is confirmed weeks or months later. The dose is measurable every session.
Three research anchors ground this in evidence. Krieger's systematic reviews established volume dose (total hard sets per muscle group per week) as the primary predictor of hypertrophy, not load per set Krieger, 2010; Krieger, 2017. Schoenfeld's 2017 meta-analysis confirmed the relationship across a broader population Schoenfeld et al., 2017. Zourdos and colleagues validated RIR as a measurable, trainable effort metric with self-reported accuracy of r=0.88-0.91 in trained lifters Zourdos et al., 2016. Helms and colleagues showed that RPE/RIR-regulated programming produces outcomes equivalent to or better than fixed-load prescription Helms et al., 2018. The trainer who tracks effort-input measures the variable that drives adaptation. The trainer who tracks load-output measures the consequence.
Input metrics are diagnostic. Output metrics are forensic. If you want to intervene before a plateau, you must measure the layer that moves before the plateau appears. Progressive overload is the mechanism. Input metrics are the instrument that tells you whether the mechanism is firing. For the complete treatment of the overload mechanism, see our progressive overload deep-dive -- volume-load is one of six overload variables, and this post is the measurement instrument for all six.
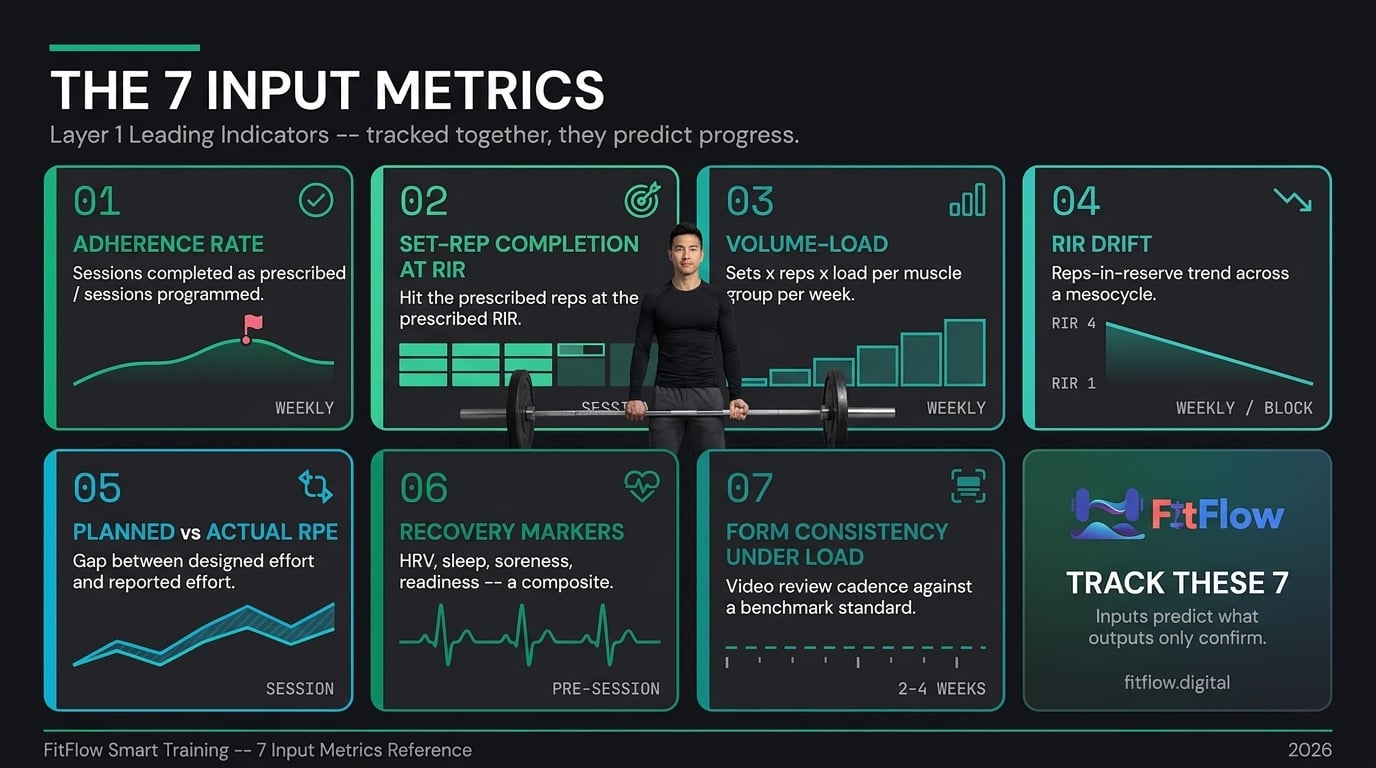
The 7 Input Metrics That Actually Predict Progress
These are the seven metrics that, tracked together, give a trainer enough signal to detect adaptation, plateau, overreach, and undertrain before any lagging indicator moves:
Adherence rate (sessions completed as prescribed ÷ sessions programmed)
Set-rep completion at target RIR (did the client hit 4x8 @ RIR 2, or miss reps at higher effort?)
Volume-load per muscle group per week (tonnage trend across the mesocycle)
RIR drift (is effort creeping up across a block without load changing?)
Planned vs. actual RPE (was the session as hard as designed?)
Recovery markers (HRV if available, sleep, soreness, readiness)
Form consistency under load (video review cadence against a benchmark)
They are harder to capture than load and attendance. They are also the actual measurements.
1. Adherence Rate
Definition. Adherence rate = sessions completed as prescribed ÷ sessions programmed. Not attendance. Completion of prescribed sessions as prescribed -- showed up, performed the prescribed exercises, hit the rep targets at the prescribed effort.
Mechanism. Adherence is the precondition for every other input. A program that is not executed does not produce adaptation. Middelbeek and colleagues' work on session-completion predictors identifies adherence as the strongest single predictor of long-term outcome Middelbeek et al., 2023. The IHRSA 2025-2026 data shows personal training retains at roughly 80% versus 60-66% for general membership, and the premium is driven by adherence infrastructure, not superior programming IHRSA, 2026.
When it is the right lever. Always. Every other metric's signal is uninterpretable if adherence is unknown. If the client did not execute the prescription, there is nothing to measure the prescription against.
Practical tracking method. Numerator = sessions where the client attended, completed the prescribed exercises, and hit within 10% of prescribed reps at prescribed RIR. Denominator = sessions programmed. Calculate weekly. Flag below 80% for intervention; below 70% for program review.
Practitioner signal. Before I touch a single programming variable, I check adherence. Below 80% and the program is not the problem. Execution is.
2. Set-Rep Completion at Target RIR
Definition. For each prescribed set, did the client hit the prescribed reps at the prescribed RIR? A 4x8 @ RIR 2 prescription is completed only if all four sets hit 8 reps with 2 reps left in reserve. 8-7-6-6 at 0 RIR is not the same prescription executed differently. It is a different prescription.
Mechanism. The prescription is the dose. If the client completes 8-7-6-6 at 0 RIR instead of 8-8-8-8 at the prescribed RIR, the dose is 15-20% less than planned. That under-dose, compounded across four to eight weeks, is often the entire cause of a "plateau" the trainer diagnoses as a programming failure. Zourdos and colleagues validated RIR as a measurable, trainable metric with r=0.88-0.91 accuracy Zourdos et al., 2016. When combined with rep completion, it is the most actionable input measurement available.
When it is the right lever. Every intermediate and advanced client. Novices in their first 12 weeks can work off set-rep completion alone because RIR estimation is less reliable during that window.
Practical tracking method. After each set, the client logs actual reps and estimated RIR. At end of session the trainer reviews completion percentage. A completion rate below 90% of prescription is a dose-miss signal.
Practitioner signal. If the prescription was 4x8 @ RIR 2 and the log shows 8-7-6-5 @ RIR 0, that client did not do the workout you programmed. That is not a programming problem.
3. Volume-Load Per Muscle Group Per Week
Definition. Volume-load = sets x reps x load, calculated per muscle group per week. Not per session. Not per exercise. Per muscle group per week.
Mechanism. Krieger's systematic reviews Krieger, 2010; Krieger, 2017 and Schoenfeld's 2017 meta-analysis Schoenfeld et al., 2017 established volume-load as the primary hypertrophy dose-response variable. More working sets per muscle group per week produces more hypertrophy, up to the individual Maximum Recoverable Volume ceiling. The ACSM 2026 Position Stand reinforces the threshold: 10 or more working sets per muscle group per week for hypertrophy Lees et al., 2026. Volume-load trend across a mesocycle tells the trainer whether total stimulus is accumulating or whether exercise substitutions and missed sets are quietly hollowing out the dose.
When it is the right lever. All hypertrophy-focused clients. Strength clients use it as a secondary metric. Fat-loss clients use it to track muscle-preservation stimulus during a caloric deficit.
Practical tracking method. At the end of each week, aggregate sets x reps x load for each muscle group. Track the week-over-week trend. Flag flat or declining volume-load in a mesocycle that should be accumulating.
Practitioner signal. Load on one lift is a data point. Volume-load per muscle group per week is the picture. If quad volume-load has been flat for three weeks in an accumulation block, the program is not accumulating -- regardless of what the top set on the squat looks like.
4. RIR Drift
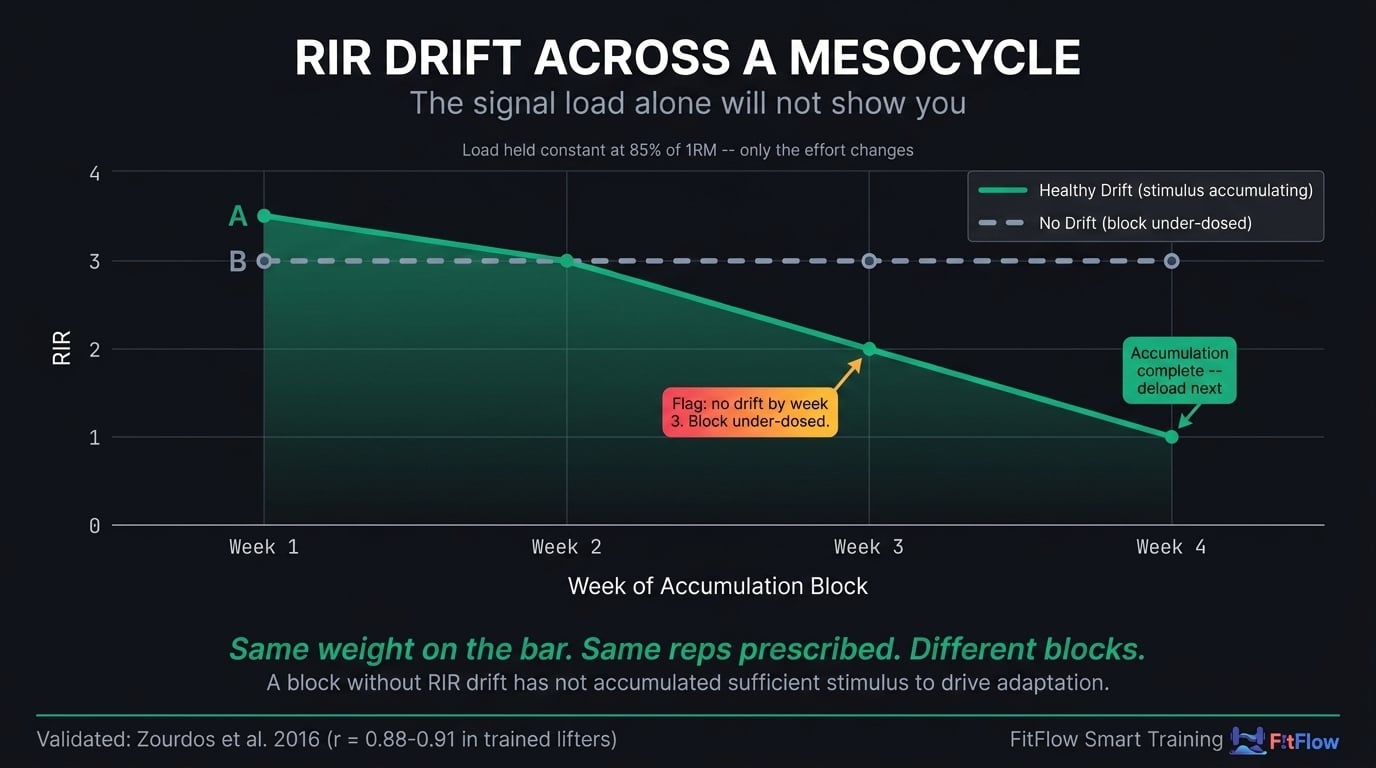
Definition. RIR drift is the trend of reps-in-reserve across a training block. A set of 4x8 at 85% 1RM should start the block at 3-4 RIR and drift toward 1-2 RIR as fatigue accumulates across weeks. That drift is the overload stimulus. If RIR does not drift, the stimulus did not increase -- even if the weight on the bar did not change.
Mechanism. Accumulated fatigue within a mesocycle progressively narrows the RIR at a given load. That narrowing is the progressive-overload mechanism at the effort-management level Helms et al., 2018; Zourdos et al., 2016. Tracking RIR drift shows whether the block is actually accumulating fatigue or whether the client is recovering fully between sessions and experiencing no net overload. A block without RIR drift is a block that did not add up.
When it is the right lever. Intermediate and advanced clients in structured mesocycles. Novices with unstable RIR estimation can defer until their reporting stabilizes, typically around the 12-week mark.
Practical tracking method. Log RIR on the last working set of each primary lift every session. Plot the trend across weeks. Flag a block where RIR has not drifted by week 3 of a 4-week accumulation as under-dosed. A 4-week accumulation block where week 1 and week 3 both report 3 RIR at the same load is not an accumulation block. It is a maintenance block wearing the wrong label.
Practitioner signal. If week 1 felt the same as week 3 at the same load, you did not load them enough to accumulate fatigue -- which means you did not load them enough to drive adaptation.
Need to know which of these 7 inputs to track for which client? The Metrics Decision Matrix maps each metric to training age, goal, and client segment. Download it free below.
Get the Complete Metrics Decision Matrix. Download the Free Matrix.
5. Planned vs. Actual RPE
Definition. Planned RPE = the effort rating the session was designed to produce (for example, "this is an RPE 8 day"). Actual RPE = what the client reported post-session. The gap between them is the signal.
Mechanism. Session-RPE is a validated internal training-load metric. Foster and colleagues established the method and showed that session-RPE integrates intensity, volume, and subjective fatigue into a single number, typically 1-10 Foster et al., 2001. A session planned as RPE 7 and reported as RPE 9 indicates accumulated fatigue, poor recovery, or prescription overshoot. A session planned as RPE 8 and reported as RPE 5 indicates under-dosing, client pacing, or movement quality issues reducing the actual stimulus below design.
When it is the right lever. Any client managing a structured mesocycle with planned intensity variation. Particularly valuable for clients whose lagging indicators look fine but who report stagnation -- the plan-vs-actual gap often explains the disconnect.
Practical tracking method. Trainer logs planned RPE at session design. Client logs actual RPE within 30 minutes post-session. Weekly review of the plan-vs-actual delta. A persistent gap of 2 or more points in either direction across three or more sessions is a prescription-calibration signal.
Practitioner signal. If the plan said 7 and the client felt it as 9 for three sessions in a row, the dose exceeded recovery. Before I write a new program I pull back total volume 15%.
6. Recovery Markers
Definition. A small basket of recovery signals tracked consistently: HRV (if the client wears a device), sleep duration, self-reported soreness (1-10), self-reported readiness (1-10). Not one metric. A composite.
Mechanism. Recovery is the substrate on which every training input operates. A session prescribed as RPE 8 landing as RPE 10 on three hours of sleep is not the session you programmed. Plews and colleagues and other HRV-guided training research demonstrate that individualized recovery tracking improves training-dose calibration Plews et al., 2013. HRV accuracy varies meaningfully by device and context -- for device-accuracy considerations, see Wearable Data Problems. Self-reported sleep and readiness, captured consistently, are often more actionable than raw HRV scores. PT Distinction's 2026 research identified sleep quality and training-load completion as the two strongest adherence predictors alongside recovery readiness PT Distinction, 2026.
When it is the right lever. All clients. Tracking depth scales with commitment: self-reported soreness + readiness for all; add sleep duration for intermediate and above; add HRV for clients with a wearable they trust. For the full recovery framework, see Why Your Clients Are Not Recovering.
Practical tracking method. Pre-session 30-second form: "Last night's sleep hours: ___. Soreness 1-10: ___. Readiness 1-10: ___." The trainer reviews before finalizing session intensity. HRV added where available and trusted.
Practitioner signal. A readiness score of 4/10 with 5 hours of sleep is the session where you run the mobility day, not the deadlift PR test.
7. Form Consistency Under Load
Definition. The cadence of video review against a benchmark form standard for each client's primary lifts. Not a session-by-session grade. A periodic check (every 2-4 weeks) that form is not degrading as load increases.
Mechanism. Form degradation is the most common unmeasured variable in progressive overload failures. Load can go up while form silently deteriorates, which means the stimulus the trainer thinks is being delivered is not the stimulus the body is receiving. Bar path drift, depth reduction, brace breakdown -- these accrue gradually and become visible at cumulative drift, often three to six weeks in. This drift is the source of a large fraction of "weight went up but no progress" client reports. Tracking form degradation is also the safest way to manage load progression: when form drifts, reduce load before the next session, not after an injury. Exercise continuity is the precondition for measuring this reliably -- see Stop Changing Exercises, Fix This Instead. You cannot benchmark form against a standard if the exercise rotated out two weeks ago.
When it is the right lever. All clients doing primary compound lifts. Particularly valuable for hybrid or fully remote clients where the trainer cannot observe form in real time.
Practical tracking method. Every 2-4 weeks, the client records a working set of each primary lift from a consistent camera angle. Trainer reviews against a form benchmark (bar path, depth, knee tracking, brace integrity). Flag drift. Reduce load if drift is present.
Practitioner signal. If bar path drifted forward and depth shortened two inches since the last video, the extra weight is not progress. It is compensation.
The Metrics Decision Matrix: When to Track What
Tracking all seven inputs for every client is the wrong default. Some clients need all seven. Some need three. The correct tracking set depends on training age, goal, and client segment. Tracking too much is expensive in trainer cognitive load; tracking too little leaves plateaus invisible until they become cancellations. Program structure is the precondition for consistent measurement -- for the program-design layer underneath this matrix, see the simplest way to structure a client program.
The Matrix
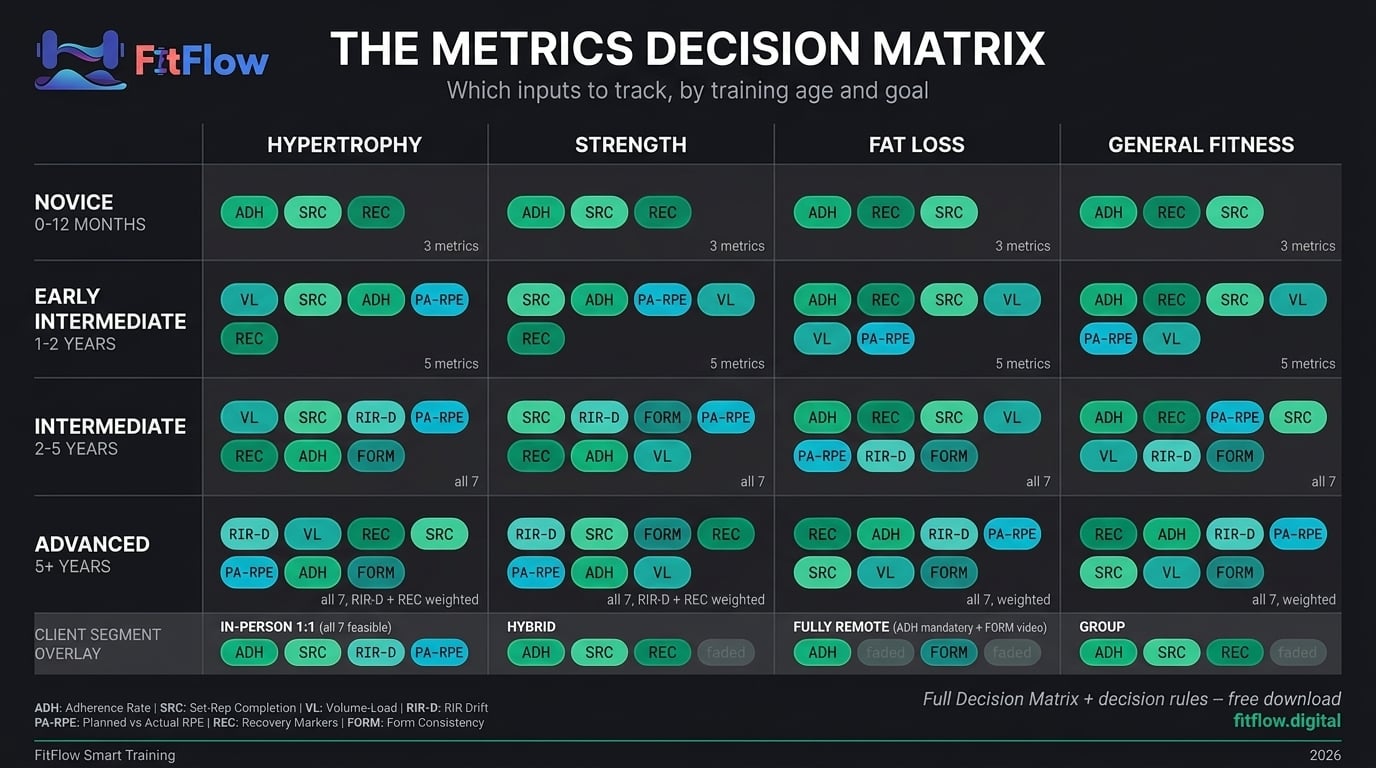
The matrix operates on three axes: training age (which metrics have interpretable signals), goal (which metrics predict the target outcome), and segment (which metrics are feasible to capture).
Axis 1: Training Age
Novice (0-12 months). Adherence rate + set-rep completion + recovery readiness. RIR estimation is unreliable. Volume-load and RIR drift are low-value until RIR reporting stabilizes.
Early Intermediate (1-2 years). Add volume-load per muscle group and planned-vs-actual RPE. Begin training RIR estimation as a skill.
Intermediate (2-5 years). All seven metrics become relevant. RIR drift and volume-load are the primary signal variables.
Advanced (5+ years). All seven. Heaviest emphasis on RIR drift and recovery markers. Load becomes a monthly-to-quarterly confirmation variable, not a session-level signal.
Axis 2: Goal
Hypertrophy. Prioritize volume-load per muscle group, set-rep completion at target RIR, RIR drift.
Strength. Prioritize set-rep completion at target RIR, RIR drift, form consistency under load. Volume-load secondary.
Fat loss / body recomposition. Prioritize adherence rate, recovery markers, set-rep completion. Volume-load tracks muscle-preservation.
General fitness. Adherence rate, recovery markers, session-RPE. Volume-load and RIR drift optional.
Axis 3: Client Segment
In-person 1:1. Trainer observes form in session; form measurement is real-time. All seven feasible.
Hybrid. Structured self-report for remote sessions. Adherence + set-rep completion + recovery markers become primary -- they are the observable signal when the trainer is not in the room.
Fully remote. Video review cadence for form is mandatory. Adherence rate becomes the single most diagnostic metric because it is the only one that certifies the session happened at all.
Group training. Adherence rate + set-rep completion + recovery readiness. Individual volume-load tracking is infeasible at scale.
Once you know what to track, the implementation layer follows. The dashboard is downstream of the framework.
When to Add or Remove Metrics
The matrix is a starting set. Three trigger rules govern adjustment.
Add a metric when the client's lagging indicators look fine but the client reports stagnation -- the scenario from the hook. Add the next layer-1 input to diagnose the gap. Typical add-sequence: from adherence and load, add set-rep completion at RIR; if that looks fine, add volume-load trend; if that looks fine, add planned-vs-actual RPE. Each addition eliminates one possible source of the invisible failure until the signal surfaces.
Remove a metric when it has been stable for six or more weeks without driving a single decision. A stable, undecisive metric buys nothing and costs attention. Strip it.
Never track a metric you cannot act on. HRV without a corresponding recovery protocol is noise. 1RM estimation without a periodized strength focus is vanity. Every metric on the dashboard should have a named intervention the trainer would take if the metric moved. If no intervention, no metric. A dashboard is an intervention protocol in disguise. The systems-level framing underneath this is in your training program is not the problem, your system is.
Common Metric Mistakes
These are systemic errors from the output-only tracking model, and from misapplying the 7-metric framework once adopted.
Mistake 1: Tracking Too Many Metrics
The trainer who tracks 15 metrics per client is tracking noise. Cognitive capacity for interpretation is bounded. 15 data points at 2 seconds of review each produces worse decisions than 4 data points at 8 seconds each. More data without more time to interpret it is less insight per data point.
The correction: select the 3-5 input metrics that match the client's training age, goal, and segment per the Decision Matrix. Every other metric is a distraction.
Practitioner signal. If you cannot explain in one sentence what decision a metric drives, that metric is noise.
Mistake 2: Tracking Too Often
Tracking frequency should match the metric's rate of meaningful change. Daily scale weight for a client in a 500-kcal deficit is meaningless below the weekly aggregation level. Session-by-session RIR is appropriate because RIR can change session-to-session. Set-by-set HRV is overkill because HRV does not move within a session at a rate the trainer can act on.
The correction: match tracking cadence to the metric's signal rate. Adherence rate: weekly. Set-rep completion at RIR: every session. Volume-load per muscle group: weekly. RIR drift: weekly within a block, reviewed at block end. Planned-vs-actual RPE: every session, aggregated weekly. Recovery markers: pre-session. Form video review: every 2-4 weeks per primary lift.
Practitioner signal. Daily weight is a mood regulator. Weekly weight is data. Monthly weight is a decision.
Mistake 3: Tracking Without Acting
A metric that never triggers a programming change is a metric that is not being used. The most common version: logging RIR faithfully every set, noticing RIR drift from 3 to 0 over 6 weeks, and writing the same program for the next block because "the client is attending." The data flagged overreach. The trainer ignored the flag. The client plateaued. The trainer diagnosed "programming failure."
The correction: every metric on the dashboard has a named intervention threshold. Adherence below 80%: intervention conversation. RIR drift to below 1 for two weeks: deload. Volume-load flat for three weeks in an accumulation block: investigate set-rep completion. Planned-vs-actual RPE persistently 2+ points high: reduce total volume 15%. If no named intervention, no metric.
Practitioner signal. You do not measure problems to confirm them. You measure them to act before they become problems.
Mistake 4: Confusing Precision with Accuracy
A 1RM estimate to one decimal place looks precise. It is precise. It is not accurate. The confidence interval around any sub-maximal-to-1RM estimator is 5-15%, widening with rep count LeSuer et al., 1997. A client whose estimated 1RM changes by 2.5 kg may have moved within the noise band of the estimator.
The correction: know the confidence interval of every metric and do not attribute meaning to changes smaller than the interval. This applies to 1RM estimates, body-fat estimates (DEXA plus or minus 1-2%, BIA plus or minus 3-5%, visual plus or minus 5-8%), HRV scores (device and context dependent; see Wearable Data Problems), and scale weight (daily fluctuation plus or minus 1-3 kg). Every number has an error bar.
Conclusion
Most trainer dashboards are forensic instruments. They describe what already happened. The dashboards that change outcomes are diagnostic -- they measure the inputs that drive adaptation, which means they move before plateaus, not after them. The metric problem was never that trainers track too little. It is that they track the wrong layer of the system.
The next time a client looks at you and says they feel stuck even though the log looks fine, you have a framework. Pull the adherence rate. Check set-rep completion at RIR. Look at the volume-load trend. The signal is somewhere in the layer underneath.
For the analytically minded lifter who is self-directed and already logs every rep: the question is not whether you have enough data. It is whether you have the right seven inputs. Measure the inputs. The outputs will follow.
Download the Metrics Decision Matrix - the practitioner checklist that maps the 7 input metrics to training age, goal, and client segment. Use it at every onboarding and every stalled-client check-in. FitFlow's client tracking system is designed to make input-metric tracking structural across a full roster, so the inputs that predict progress are as visible as the outputs that confirm it.
Frequently Asked Questions
Comments