Busy Is Not Profitable: The Structural Reason Most Personal Trainers Plateau Below $8K/Month

80% of personal trainers say client acquisition is harder or has plateaued (Trainerize 2026 State of the Personal Training Industry Report). The instinctive response is to add more sessions to existing clients. The arithmetic says adding more sessions is exactly what compounds the problem. Median generalist hourly rates have declined 2.3% since 2023 in inflation-adjusted terms (NASM 2026). Working more hours within a structurally compressed model expands the gap between what you bill and what you keep.
Most trainers measure revenue per session. The number that actually predicts profitability — margin per available hour — sits one layer underneath, and it gets worse as your schedule fills.
This article is the dissection beneath the diagnosis. If Post 22 (Why Most Trainers Never Cross $5K/Month) was the diagnosis ("here is the pattern of why you are stuck"), this post is the unit-economics reason — margin per available hour — and the math that exposes it. If Post 21 (The Hidden Cost of Admin Work) quantified the dollar cost of admin time, this post quantifies how that admin time destroys margin per available hour on the revenue side. Two sides of the same equation; this is the revenue side.
This is not a motivational post — it is a unit-economics breakdown of why busyness compounds the revenue problem, with two computed archetype examples and the four structural levers that fix it.
See Your Real Hourly Rate Before You Read Another Word. Most trainers compute revenue per session. The calculator computes margin per available hour — the number that actually predicts profitability. Twelve inputs, three outputs, ninety seconds. Run the Free Calculator.
The Reframe: Revenue Per Session Is the Wrong Unit
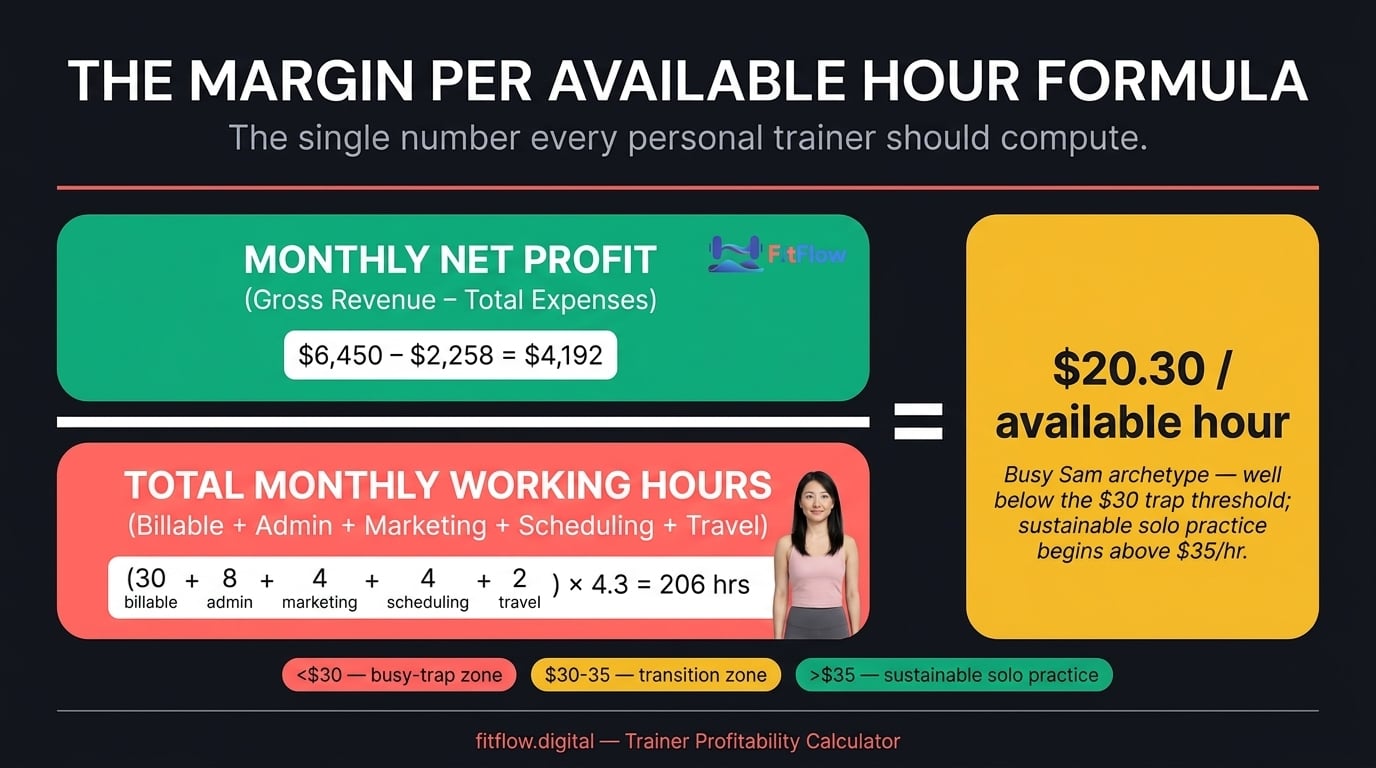
Every metric most trainers track — revenue per session, monthly gross revenue, client count, sessions per week — is a vanity metric that hides the binding constraint. The binding constraint is margin per available hour: profit (after expenses) divided by ALL working hours, billable plus admin plus marketing plus scheduling plus travel plus recovery.
The median generalist trainer charges $39.50 per hour (NASM 2026, HevyCoach 2026). Solo trainers run 25-35 billable hours against 40-50 total weekly working hours (Dojo Business 2026). That gap — 35-45% of working time consumed by non-billable overhead — is the structural leak that separates revenue from margin. A well-managed trainer reports 50-70% profit margin; a poorly managed trainer reports 20-30% (Dojo Business 2026). Studios start at only 8-10% margin before any management quality is factored in (Financial Models Lab 2026). Trainerize benchmarks "healthy margin" at over 60% (Trainerize 2026 Profit Margin Guide). Almost no solo trainer hits that benchmark using the default delivery model.
Here is the mechanism, stated plainly. When a trainer bills $50 per session for 30 sessions per week, the perceived rate is $50 per hour and the perceived revenue is $1,500 per week. But that same trainer also worked 15-20 unbillable hours that week — admin, scheduling, marketing, no-show recovery, travel. Computing revenue against ALL 45 working hours yields a real rate near $33 per hour. Subtract expenses (rent, software, insurance, marketing — typically 30-50% of revenue) and the profit per available hour drops to $17-23. The trainer's perceived rate ($50) is 2.2-3x the actual margin per available hour. Every additional session at the same delivery model widens this gap, because admin time scales with client count.
The reframe in one sentence: revenue per session is what you charge during a billable hour. Margin per available hour is what you actually keep across every working hour. The two numbers are usually 60-70% apart, and most trainers track only the first.
The Busy-vs-Profitable Math (Worked Examples)
"I would have like [sic] sometimes 12 or 13 clients booked in one day, some half hour, some hour sessions. And the only way that I could make any more money was by booking more clients and I was just grinding myself to death." That is a verbatim practitioner quote (informal speech preserved) from a Two-Brain Business case study. It is what busy looks like. Now let us compute what busy costs.
The two archetypes below use realistic, conservatively sourced numbers from the 2026 industry data set. They are not edge cases. They sit on either side of a structural decision about delivery model design — the median experience for trainers who made that decision one way (Busy Sam) versus the other (Profitable Sam).
Archetype 1: Busy Sam ($50/session, 30 billable hours/week)
Sam runs the default solo 1:1 model. He charges $50 per session, books 30 sessions per week, and operates at capacity. The numbers behind that sentence look like this.
Variable | Value |
|---|---|
Billable hours/week | 30 |
Admin / marketing / scheduling / no-show / travel hours/week | 18 |
Total working hours/week | 48 |
Session rate | $50 |
Gross revenue/week | $1,500 |
Gross revenue/month (4.3 weeks) | $6,450 |
Monthly expenses (rent, software, insurance, marketing, certifications — 35% of revenue) | $2,258 |
Net profit/month | $4,192 |
Profit margin (Net / Gross) — the wrong denominator | 65% |
Net profit per BILLABLE hour | $32.50 |
Net profit per AVAILABLE hour (the metric that matters) | $20.30 |
Busy Sam looks profitable on paper (65% margin) only because the margin calculation uses revenue as the denominator instead of total working hours. His effective hourly rate — what he actually earns per hour worked — is $19-20. He cannot raise it by adding sessions, because each additional session adds proportional admin overhead. His admin-to-billable ratio is 0.6 (18 admin hours for every 30 billable). At 40 billable hours, recovery time and no-show friction push admin time past 24 hours per week. The ceiling is arithmetic, not motivational.
His perceived rate ($50) is above the $39.50 median (NASM 2026). His actual margin per available hour ($20) sits in the floor-hour (in-gym billable hour) range OPEX Fitness flags as structurally insufficient (OPEX Fitness reports trainers at $15-$35 per floor hour and still falling short). The 60% gap between perceived rate and actual margin is a delivery-model problem, not a Sam problem.
Archetype 2: Profitable Sam (hybrid model, 22 revenue hours, 30 total weekly hours)
Profitable Sam coaches the same population as Busy Sam, but he restructured his delivery model 18 months ago. He runs a hybrid stack: premium 1:1 sessions at the top, small-group cohorts in the middle, asynchronous coaching at the bottom. The numbers behind his week look like this.
Note: the 22 hours below reflect direct revenue-generating activities (1:1, group, async check-ins). Total working hours including admin and marketing are 30, also shown in the table. The blended effective rate across all 22 revenue hours is approximately $110/hour ($2,428 ÷ 22), and approximately $81/hour computed against all 30 working hours.
Variable | Value |
|---|---|
1:1 billable hours/week (at $95/session) | 14 hours = $1,330 |
Small-group time blocks/week (3 clients per group at $45/session) | 4 hours = 12 client-sessions × $45 = $540 |
Asynchronous coaching revenue (12 clients × $200/month ÷ 4.3 weeks) | $558/week from ~4 hours of async check-in time |
Total working time on revenue activities/week | 22 (14 + 4 + ~4 async) |
Admin / marketing / scheduling hours/week | 8 (automation + smaller client base + recurring billing reduces admin overhead by ~50%) |
Total working hours/week | 30 |
Gross revenue/week | $1,330 (1:1) + $540 (group) + $558 (async) = $2,428 |
Gross revenue/month (4.3 weeks) | $10,440 |
Monthly expenses (33% of revenue — slightly lower because hybrid scales) | $3,445 |
Net profit/month | $6,995 |
Profit margin (Net / Gross) | 67% |
Net profit per BILLABLE hour | $74 |
Net profit per AVAILABLE hour (the metric that matters) | $54 |
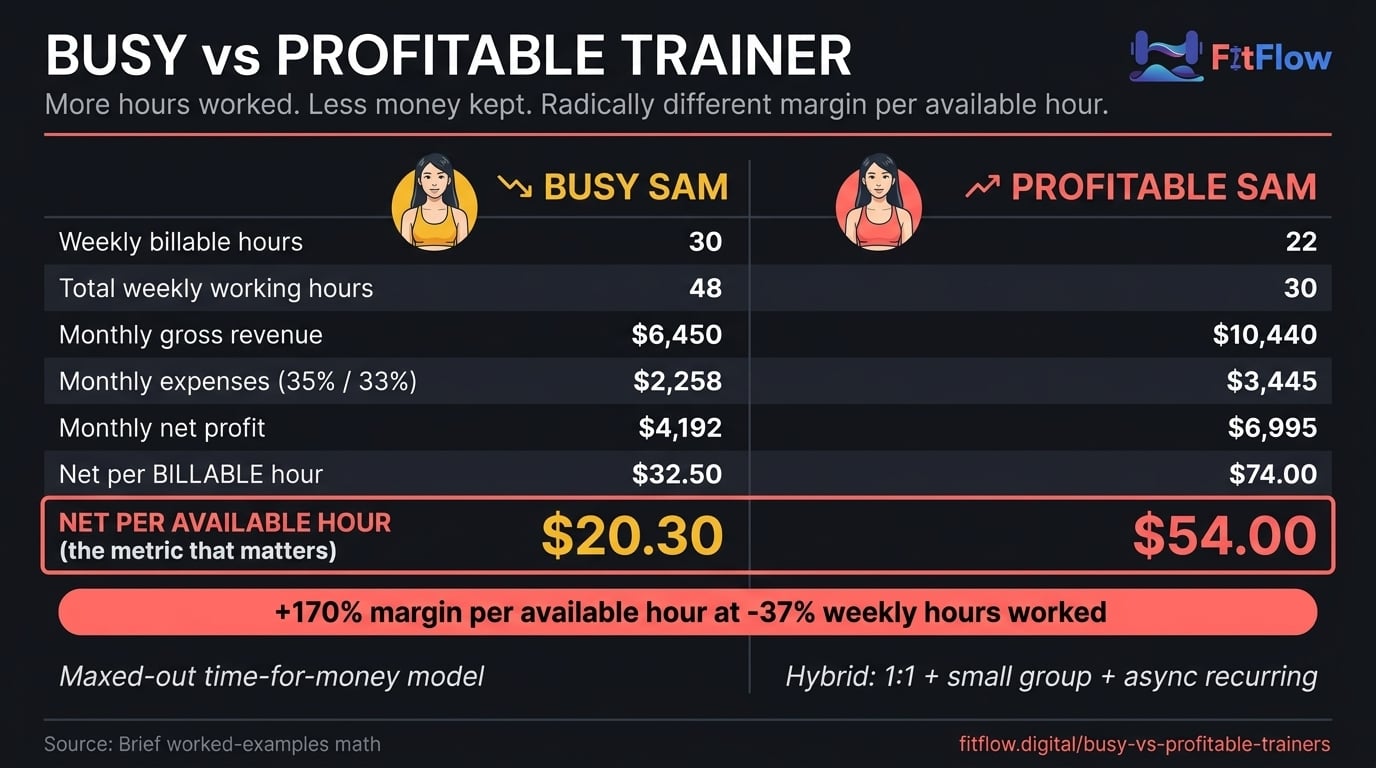
Profitable Sam earns 67% more per month while working 18 fewer hours per week. His margin per available hour is $54 versus Busy Sam's $20 — a 2.7x improvement. The improvement does not come from charging more per session. $95 versus $50 is a 90% rate increase, not a 270% one. It comes from restructuring the delivery model so each available hour produces revenue from multiple sources: 1:1 premium, small-group leverage, and asynchronous recurring revenue. The hybrid 1:1 plus group multiplier is independently confirmed at 2.3x the revenue of solo 1:1 work for the same time investment (HevyCoach 2026). Roughly 50% of trainers now use hybrid as their primary delivery model (Trainerize 2026) — confirming both market validation and competitive necessity.
The Side-by-Side Comparison
Metric | Busy Sam | Profitable Sam | Delta |
|---|---|---|---|
Total weekly working hours | 48 | 30 | -37% |
Monthly gross revenue | $6,450 | $10,440 | +62% |
Monthly net profit | $4,192 | $6,995 | +67% |
Margin per available hour | $20 | $54 | +170% |
Burnout risk | Elevated (above 32.8% industry baseline) | Low (sustainable model) | — |
If your margin per available hour is below $30, you are in the busy-trainer trap regardless of your gross revenue or session count. Above $35 enters the sustainable solo-practice band; the $30-35 range is a transition zone (not yet trapped, not yet sustainable). The fix is structural redesign of the delivery model, not motivational redesign of the schedule. If you recognized yourself in Busy Sam, Post 22 diagnoses the four structural failures that hold the trap closed. This post is the unit-economics mechanism beneath those failures.
If You Recognized Yourself in Busy Sam, the Number You Need Is One Click Away. Busy Sam earns $20 per available hour. Profitable Sam earns $54. The gap is structural, not motivational. The calculator tells you exactly where you fall. Show Me the Gap.
Why Busyness Compounds Margin Destruction
The acquisition response trap explains why busy trainers stay broke. 80% of trainers say acquisition is harder (Trainerize 2026). The instinctive response — maximize hours with existing clients — is what turns busy into bankrupt. Every additional billable hour adds proportional overhead time (admin, scheduling, no-show recovery, body recovery), eroding margin per available hour. The trainers who escape the plateau are not the ones working the most hours. They are the ones with the highest margin per available hour.
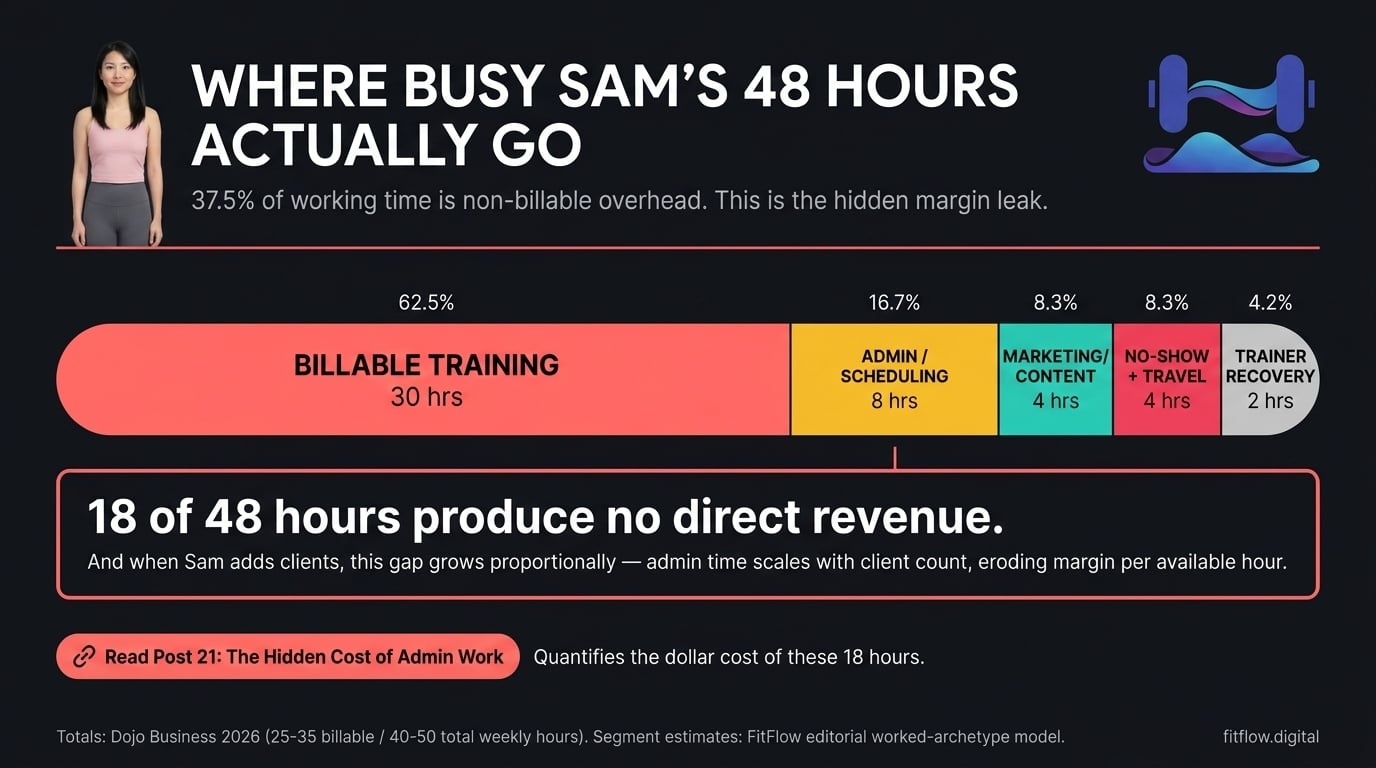
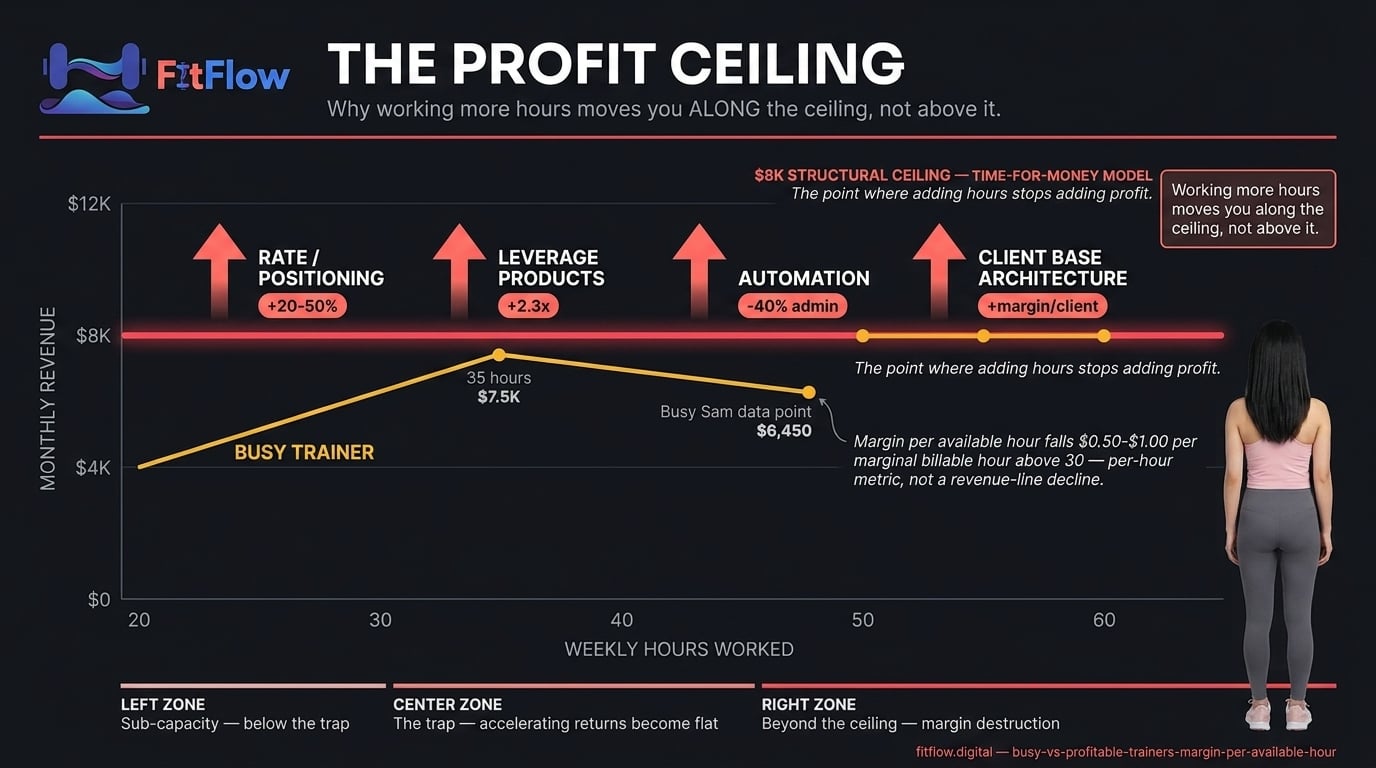
The compounding mechanism is numerical. At 30 billable hours per week, admin runs 15-18 (a 0.5-0.6 ratio). At 35 billable, admin grows to 18-22. At 40 billable, admin compounds to 22-27 as scheduling friction, no-show recovery, and trainer fatigue increase non-linearly. Each marginal billable hour past 30 typically reduces margin per available hour by approximately $0.50 to $1.00, because the added admin overhead exceeds the marginal revenue contribution after tax. Studios prove the upper bound: variable labor costs can run as high as 427% of target revenue at low utilization (Financial Models Lab 2026). Solo trainers experience the same dynamic without the studio overhead — the labor is their own time, uncompensated.
Why traditional fixes do not work: raising rates by $5-10 is a 10-20% adjustment that does not change the structural ratio. Adding clients compounds the problem. Better self-scheduling apps help marginally but do not break the time-for-money architecture. The only fixes that change margin per available hour are (a) decoupling revenue from billable hours (Lever 2 below), (b) automating admin so the ratio drops below 0.3 (Lever 3), (c) raising the effective rate via positioning (Lever 1, grounded in Post 26), and (d) restructuring the client base toward recurring high-margin revenue (Lever 4).
The burnout connection is structural. 32.8% of fitness professionals report personal burnout (ISSA, OPEX, Sogolytics). Burnout is not a willpower problem — it is the predictable outcome of a delivery model that demands increasing time inputs to maintain margin. The market is concentrating around high-margin tiers; industry value grew from $13.9B in 2025 to $15.6B in 2026 (Future Market Insights 2026), and that growth is captured by trainers whose delivery model can absorb it without burning out the operator.
The Four Levers That Fix the Margin Equation
There are four primary levers that move margin per available hour. Every prescription you have read in fitness business content lives inside one of them. The trick is sequencing.
Lever 1: Rate and Positioning
The slowest lever. Raising your effective rate moves margin per available hour linearly, but rate increases have a structural ceiling tied to your positioning. A specialist commands $100-$300 per session; a generalist commands $30-$80. The gap is not skill — it is positioning specificity.
Premium-positioned trainers earn $400-$500+ per client per month versus entry-level $150-$250 (FitBudd 2026, Dojo Business 2026). The 2-3x revenue gap is delivered by delivery-model architecture and positioning specificity, not session count. Run the Pricing-vs-Positioning Diagnostic from Post 26 before your next rate increase. Rate adjustments without positioning shifts churn clients without expanding margin.
Lever 2: Leverage Products
The fastest margin lever for solo trainers. Adding revenue streams that do not consume billable hours decouples revenue from time. The simplest entry: small-group cohorts. Three to four clients at $45-$65 per person per session yields $135-$260 per hour versus the $50-$95 1:1 range shown in the Sam archetypes above.
Hybrid 1:1 plus group yields 2.3x the revenue of solo 1:1 for the same time (HevyCoach 2026). Approximately 50% of trainers now use hybrid as their primary delivery model (Trainerize 2026). Add ONE leverage product within 60 days — small-group (lowest learning curve) or asynchronous coaching ($150-$250 per client per month × 5-12 clients = $750-$3,000 from roughly 3-5 hours of async check-in time). Post 8 is the implementation blueprint for hybrid scaling.
Lever 3: Automation
The margin protector. Automation does not directly raise revenue, but it reduces admin time by 40-60% — raising margin per available hour by shrinking the denominator without shrinking the numerator. The math is asymmetric in your favor.
Automating scheduling, intake, billing, and follow-up typically recovers 8-12 hours per week for the average solo trainer. Applied to Busy Sam, that converts roughly 10 admin hours into either 10 billable hours (+$500/week) or 10 recovery hours (lower burnout risk, sustained margin). Audit your admin time across one week. Automate the highest-volume sink within 30 days. Post 25 is the automation playbook — the margin math says automation moved from "nice to have" to necessity.
Lever 4: Client Base Architecture
The structural lever. Most trainers run a heterogeneous client roster — a few high-margin clients, many mid-margin, several low-margin. The temptation is to treat them equally. The margin math says: do not.
Compute margin per client per month for your current roster. Identify the bottom-quartile clients (low session frequency plus high admin overhead plus low referral generation). Either reposition them (1:1 to small-group), restructure them (async-only), or replace them. Removing five low-margin clients and replacing them with three high-margin clients usually nets higher margin per available hour despite the lower headcount. Post 11 develops the systems philosophy that makes this operationally durable.
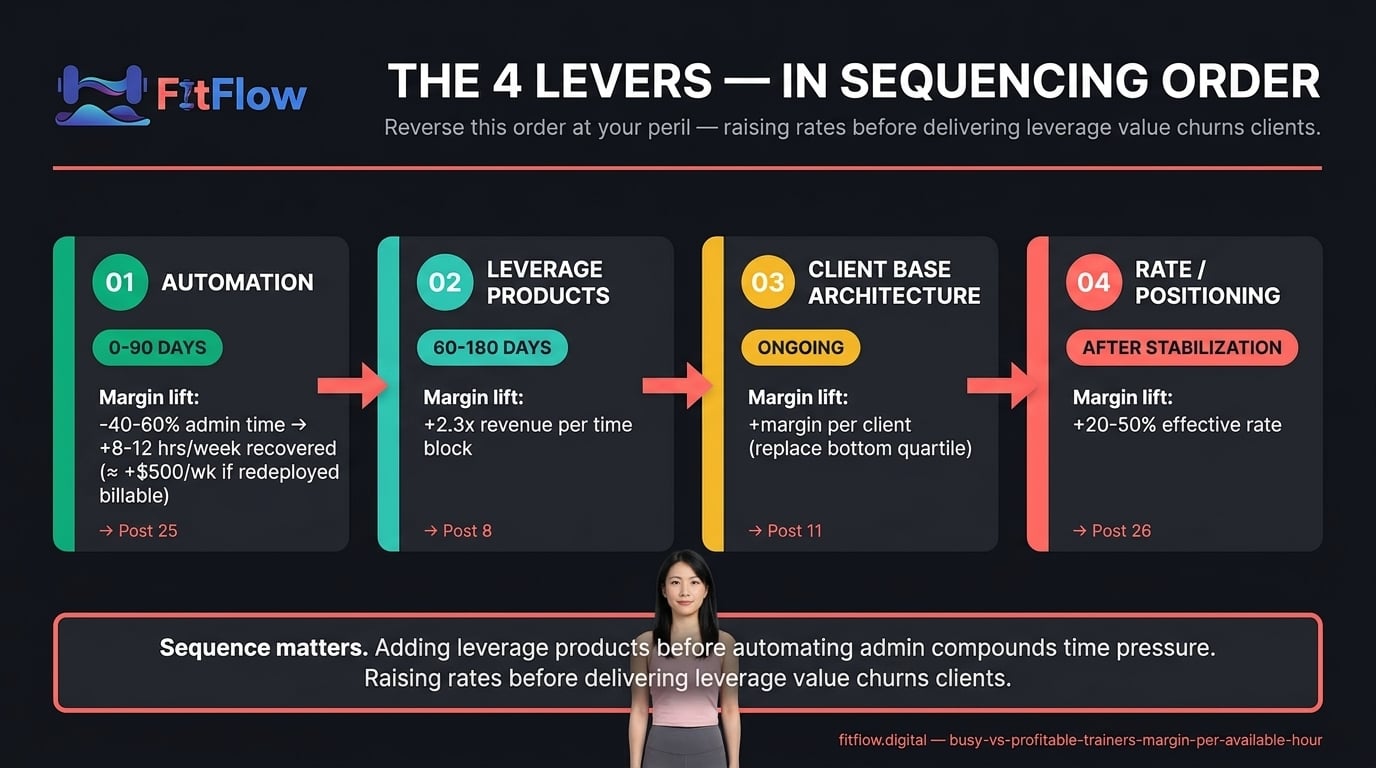
Lever Sequencing: Which Lever First?
Most trainers should sequence: Lever 3 (Automation) first within 90 days, then Lever 2 (Leverage Products) within 60-180 days, then Lever 4 (Client Base Architecture) ongoing, then Lever 1 (Rate and Positioning) after the previous three are stable. Reverse this order at your peril — raising rates before delivering leverage value churns clients; adding leverage products before automating admin compounds time pressure.
A balanced caveat applies here: some trainers genuinely do need to raise rates first. If your session rate sits in the bottom decile of your local market and your positioning is already specific, Lever 1 moves first. The mechanism still applies — you are simply resolving the rate variable before optimizing the structural ones.
Implementation: The 30-Day Margin Audit
A four-week audit converts the mechanism essay into a measurable result. Most trainers see a 10-20% lift in margin per available hour from a single lever change in the first month, with compounding gains over 90-180 days.
Week 1: Compute (Days 1-7). Run the Trainer Profitability Calculator. It outputs three numbers: effective hourly rate (revenue divided by all working hours), margin per client per month, and profit ceiling at current delivery model. Most trainers find their effective hourly rate is 50-70% lower than they thought.
Week 2: Diagnose (Days 8-14). Complete the Busy-vs-Profitable Audit (10 questions). The audit identifies which lever is most accessible. Common patterns: trainers under $5K/month start with Lever 3 plus Lever 2; trainers $5-8K/month start with Lever 4 plus Lever 2; trainers above $8K/month start with Lever 1 plus Lever 4.
Week 3: Pilot (Days 15-21). Implement ONE change toward your highest-priority lever — a small-group cohort with three existing clients (Lever 2), an automated intake-plus-scheduling workflow (Lever 3), or a restructure conversation with bottom-quartile clients (Lever 4).
Week 4: Re-compute (Days 22-30). Run the calculator again. Track the delta in margin per available hour. Most trainers see measurable lift within 30 days from one disciplined intervention.
For solo independent trainers: every step is in your control. For gym-employed trainers: Weeks 1 and 2 are yours entirely; Week 3 may require a conversation with gym management about specialization within their service mix. Implementation is ultimately a systems problem; Post 11 is the operational philosophy.
Key Takeaways
Revenue per session is a vanity metric. Margin per available hour is the binding constraint.
The gap between perceived rate and effective rate is typically 60-70%. Most trainers earn $15-20 per hour after overhead, not the $50-80 they see on the invoice.
Working more hours expands the gap, because admin overhead scales with client count.
Two archetypes prove the structural difference: Busy Sam earns $20 per available hour at 48 weekly hours; Profitable Sam earns $54 per available hour at 30 weekly hours.
Raising rates by $5-10 is a 10-20% rate adjustment that does not change the structural ratio.
Four levers move margin per available hour: Rate and Positioning, Leverage Products, Automation, Client Base Architecture.
Sequence matters more than tactic selection: the most common failed restructure leads with Lever 1 (rate increases) before the delivery model can support higher prices. Automation and leverage come first; rates last.
Compute margin per available hour before your next business decision. Use the Trainer Profitability Calculator.
Get the Calculator + the Audit + the 30-Day Reset Plan — Free. Three resources, one PDF. The 12-input calculator computes your margin. The 10-question audit identifies your highest-priority lever. The 30-day plan walks you through pulling it. Download the Free Kit.
Frequently Asked Questions
Comments