Wearable Data Problems: Why Your Clients Fitness Trackers Are Lying to Them (And What Trainers Should Do About It)
Fitness tracker accuracy is the question every trainer should be asking — and almost none of them are. Wearable technology is the number one global fitness trend for 2026, for the twentieth consecutive year (ACSM 2026 Worldwide Fitness Trends Survey). Nearly half of all U.S. adults now wear a fitness tracker or smartwatch, and 70% of those users act on device data to make exercise, nutrition, or recovery decisions. Your clients are not just wearing these devices. They are trusting them.
Here is the problem: the metric your clients rely on most — calorie burn — carries a 27.96% average error rate on Apple Watch alone (University of Mississippi 2025 meta-analysis, 56 studies) and up to 93% error across consumer devices (Stanford Medicine 2017). In February 2026, WHOOP deployed a "comprehensive revision" of its heart rate algorithm — described independently as "core algorithmic rework, model re-architecture and retraining" — implicitly confirming that years of recovery scores were built on a foundation less reliable than users were told (the5krunner.com, February 28, 2026).
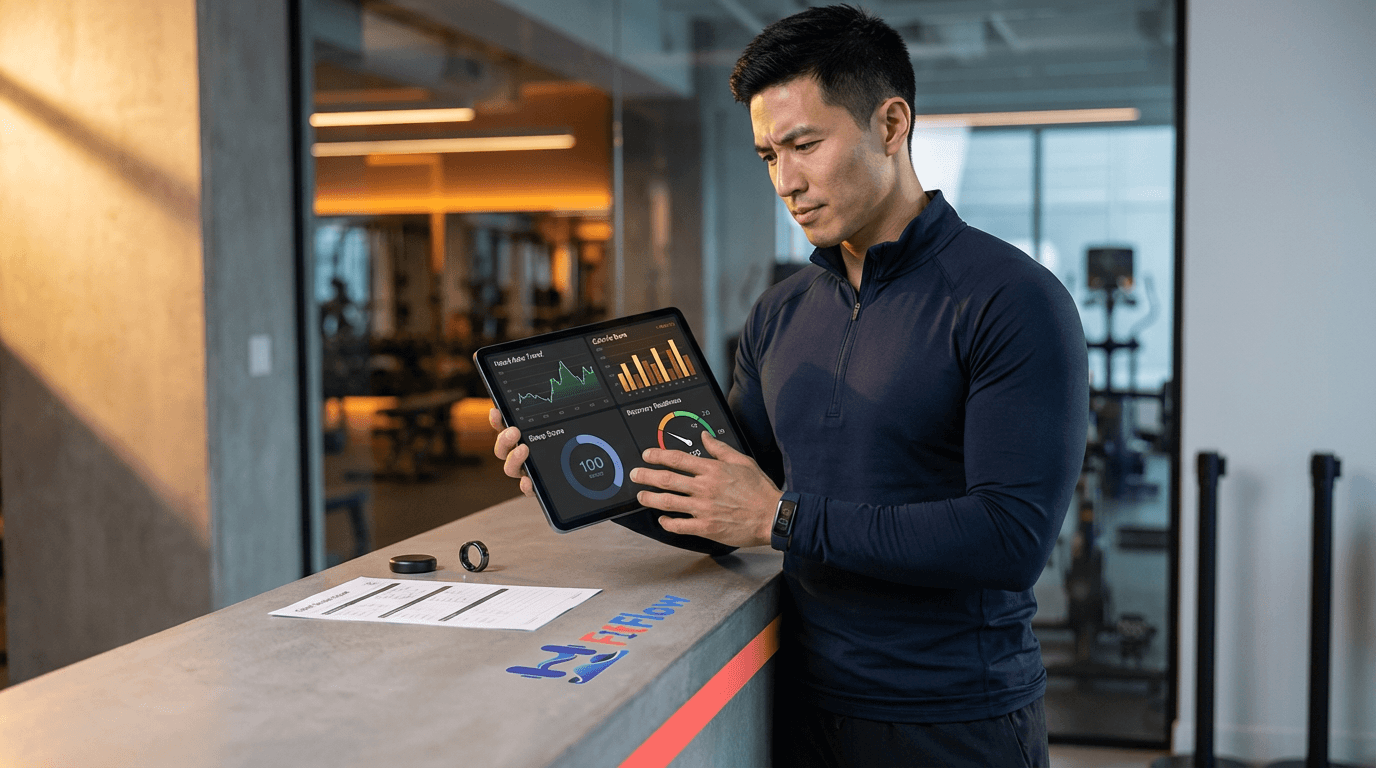
Your clients are making real decisions — what to eat, whether to train, whether they "recovered enough" — based on numbers that are, in many cases, fiction. And they are bringing that fiction to you every session.
The question is not whether wearable data is useful. It is. The question is: do you know which numbers to trust? This article gives you the metric-by-metric accuracy breakdown, the device hierarchy that matters for coaching decisions, the clinical phenomenon of wearable-induced anxiety, and a practical interpretation framework you can apply starting this week. The trainers who thrive in the wearable era will be the ones who become the interpreter — the human layer that turns noisy signals into the data layer AI coaching is built on.
Which Wearable Metrics Can You Actually Trust?. Get the Free Checklist.
The Accuracy Paradox — Your Clients Trust the Numbers That Are Most Wrong
The ACSM's 2026 survey — based on responses from over 2,000 clinicians, exercise physiologists, and certified health professionals — placed wearable technology at the top of the global fitness trend list for the twentieth year running. Approximately 50% of U.S. adults now own a fitness tracker or smartwatch. Among those users, 70% report that device data directly influences their exercise or recovery decisions.
These are not early adopters. This is the mainstream. And the mainstream has a problem it does not know about: the accuracy hierarchy of wearable data is inverted from what users expect. The metrics your clients obsess over are the ones their devices get most wrong:
Heart rate: 3-5% median error across devices. The most accurate consumer wearable metric. Clients rarely discuss it.
Step count: approximately 8-9% underestimation on average. Reasonably accurate. Clients glance at it.
HRV (heart rate variability): 6-10% error depending on device. Moderately accurate but widely misinterpreted. Clients cite it to justify skipping sessions.
Sleep stages: 50-65% accuracy for stage classification. Poor reliability, but clients treat composite sleep scores as medical diagnostics.
Calorie burn: 27-93% error depending on device and activity. The worst accuracy of any consumer wearable metric. The one clients use to decide what to eat.
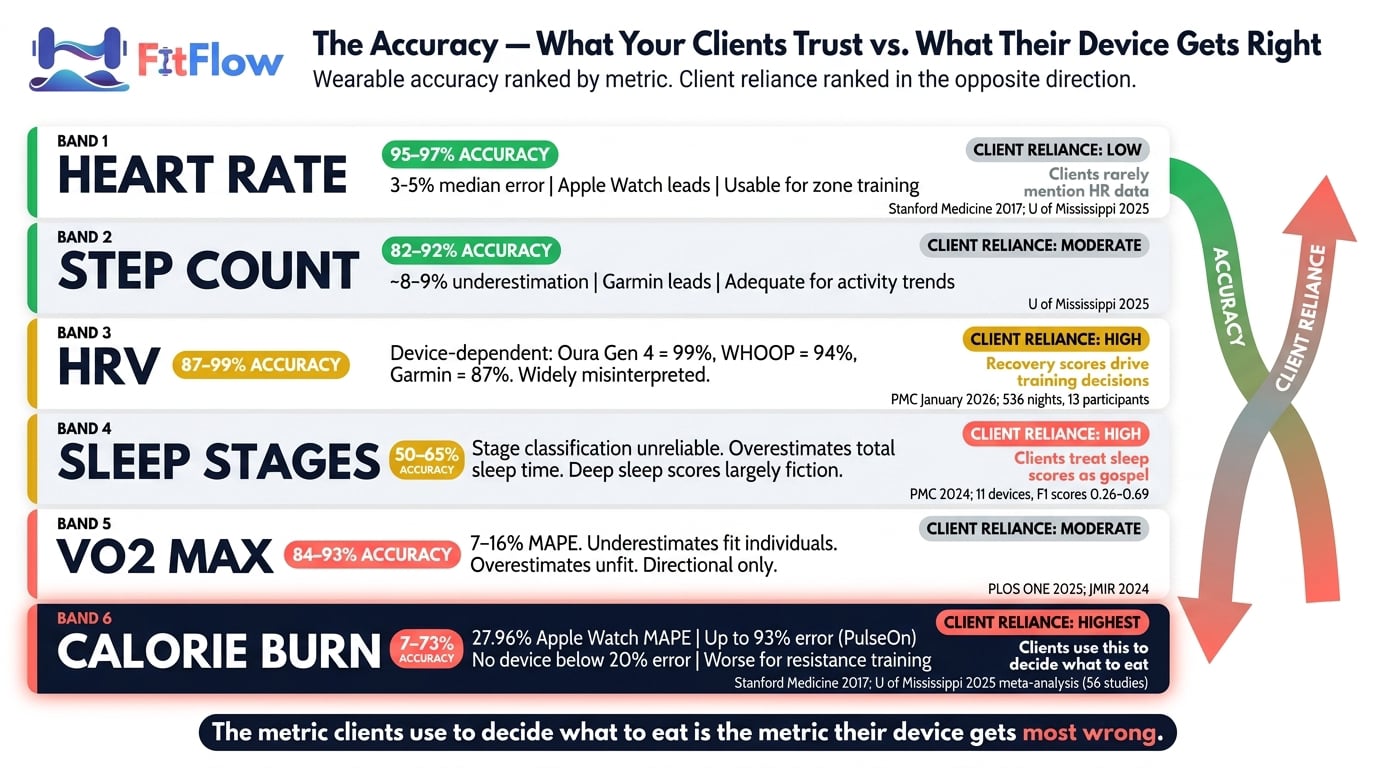
A 2025 meta-analysis from the University of Mississippi, led by Professor Minsoo Kang and encompassing 56 Apple Watch studies, found a mean absolute percentage error (MAPE) of 27.96% for energy expenditure — more than three times the acceptable margin for clinical use. The Stanford Medicine study from 2017, testing seven devices, found that no device achieved calorie accuracy below a 20% error rate. Professor Kang summarized it directly: "These devices are great for keeping track of habits and staying motivated, but do not take every number as 100% truth, especially the calories."
The accuracy inversion is the core coaching challenge. Your clients trust the data that deserves the least trust. They ignore the data that is actually reliable. And unless you correct that inversion, you are coaching against noise.
What the Science Actually Says — Metric-by-Metric Accuracy Breakdown
Broad claims about wearable accuracy are not useful. The accuracy varies dramatically by metric, by device, and by activity type. What follows is the peer-reviewed breakdown that trainers need to interpret client data correctly.
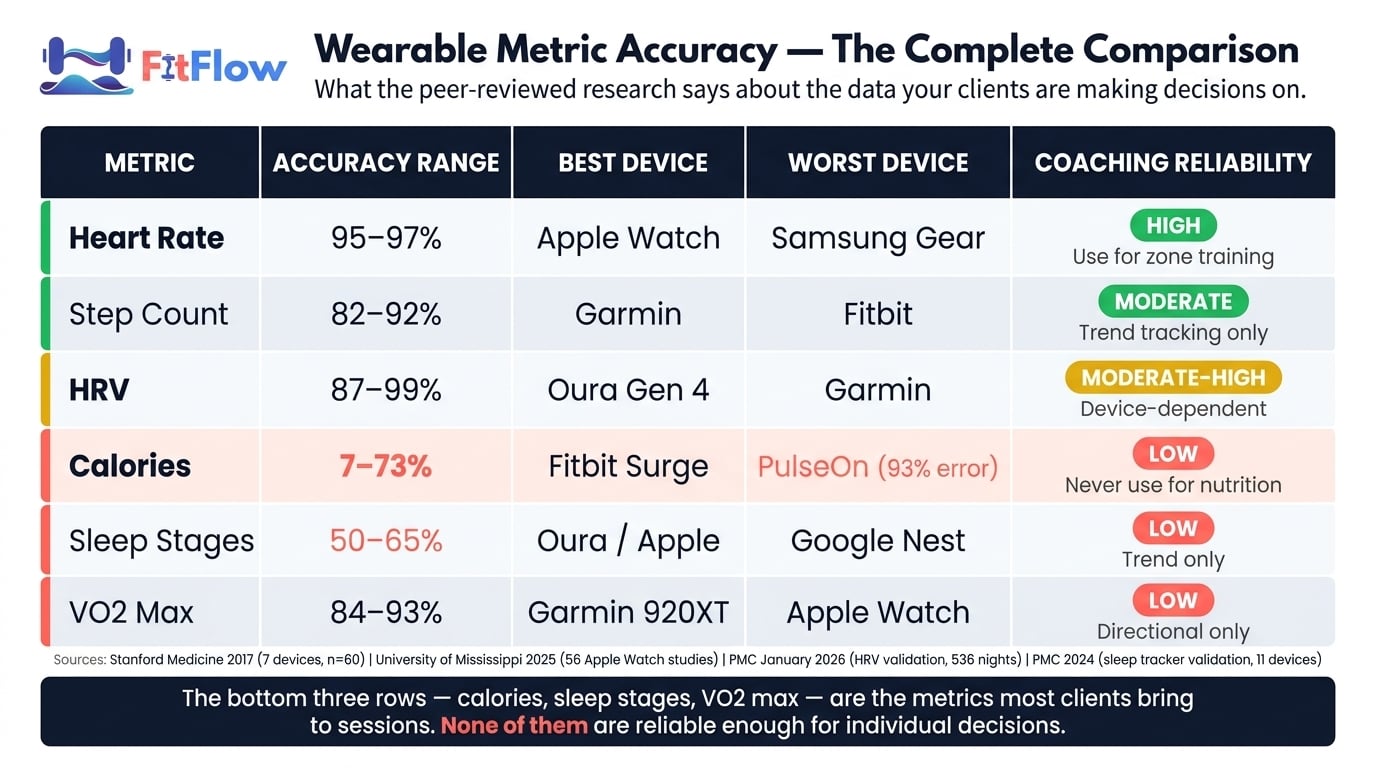
Metric | Accuracy Range | Best Device | Worst Device | Coaching Reliability |
|---|---|---|---|---|
Heart Rate | 95-97% | Apple Watch | Samsung Gear | High — use for zone training |
Step Count | 82-92% | Garmin | Fitbit | Moderate — trend only |
HRV | 87-99% | Oura Gen 4 | Garmin Fenix 6 | Moderate-High — device matters |
Calories | 7-73% | Fitbit Surge | PulseOn | Low — never use for nutrition |
Sleep Stages | 50-65% | Oura / Apple Watch | Google Nest Hub | Low — trend only |
VO2 Max | 84-93% | Garmin 920XT | Apple Watch | Low — directional only |
Heart Rate: The One You Can Actually Trust
Heart rate is the most reliable metric across all consumer wearables. The University of Mississippi meta-analysis found an Apple Watch heart rate MAPE of just 4.43%. The Stanford Medicine study confirmed that six of seven devices tested achieved heart rate error below 5%. For zone-based training and intensity monitoring, heart rate data is clinically adequate.
The coaching implication: when your client asks, "Was I in the fat-burning zone?", the heart rate data supporting that question is reasonably trustworthy. The calorie estimate derived from it is not.
Step Count: Adequate for What It Claims
Step count accuracy ranges from approximately 82% to 92% depending on device and walking speed. The University of Mississippi data shows an 8.17% MAPE for Apple Watch step counting. Steps are adequate for tracking general activity trends — whether a client is moving more or less week over week — but should not be treated as exact measurements.
Calorie / Energy Expenditure: The Dangerous Metric
This is where the data should alarm every trainer who has ever referenced a client's wearable calorie count. No device in the Stanford study achieved calorie error below 20%. The worst performer, PulseOn, reached 92.6% error.
The mechanism matters: wearables estimate energy expenditure using proprietary algorithms that combine heart rate, accelerometer data, and user-input biometrics. These algorithms are not validated against indirect calorimetry — the gold standard for metabolic measurement — for most activities. They are particularly poor during resistance training, where optical PPG (photoplethysmography) sensors misread isometric contractions and post-set heart rate elevation as sustained aerobic effort, systematically over-estimating calories burned during lifting.
The coaching danger is specific: clients who "eat back" their exercise calories based on wearable estimates may erase their calorie deficit entirely. A client targeting a 500-calorie daily deficit who adds 400 wearable-estimated "exercise calories" back into their nutrition plan could end the day at maintenance — while believing they are in deficit. The solution is a boundary: never adjust nutrition plans based on wearable calorie data. Treat it as a rough motivational indicator, not a foundation for nutrition planning.
HRV: Accurate Enough to Matter, But Device Selection Is Critical
A January 2026 validation study published in PMC tested five consumer wearables against electrocardiogram (ECG) reference across 536 nights with 13 healthy adult participants. The concordance correlation coefficients (CCC) revealed a clear device hierarchy:
Oura Gen 4: CCC = 0.99, MAPE = 5.96%
Oura Gen 3: CCC = 0.97, MAPE = 7.15%
WHOOP 4.0: CCC = 0.94, MAPE = 8.17%
Garmin Fenix 6: CCC = 0.87, MAPE = 10.52%
Polar Grit X Pro: CCC = 0.86 (lowest tested)
The surprise: Garmin — one of the most widely used devices among serious athletes — ranks last among the three major recovery-focused devices for HRV accuracy. A 10% drop in HRV on an Oura Gen 4 is a signal worth investigating. A 10% drop on a Garmin Fenix 6 may be signal or noise — the error margin overlaps with the change itself.
Practical rules: pick a device and stick with it (trend consistency within a single device matters more than absolute accuracy). Use 14-30 day rolling averages, not daily scores. Know which device your client wears before interpreting their data — an HRV reading of 45ms from an Oura Gen 4 and an HRV reading of 45ms from a Garmin Fenix 6 carry different confidence intervals.
Sleep: Detects That You Slept, Not How Well
Wearable sleep tracking achieves 86-89% accuracy for binary sleep/wake detection. That sounds adequate until you examine sleep stage classification, where accuracy drops to 50-65%. A 2024 validation study published in PMC tested 11 devices and found macro F1 scores ranging from 0.26 to 0.69 for sleep stage classification. A client's sleep score is a rough estimate of whether they slept, not a diagnostic of sleep quality.
VO2 Max: Directional Signal, Not a Diagnostic
Estimated VO2 max from wearables carries a 7-16% MAPE depending on device and population (PLOS ONE / JMIR 2024-2025). VO2 max trends over months can indicate improvements in cardiorespiratory fitness, but single readings should never be used for training prescription.
You Just Read the Accuracy Data. Now Apply It. Download the Reference Checklist.
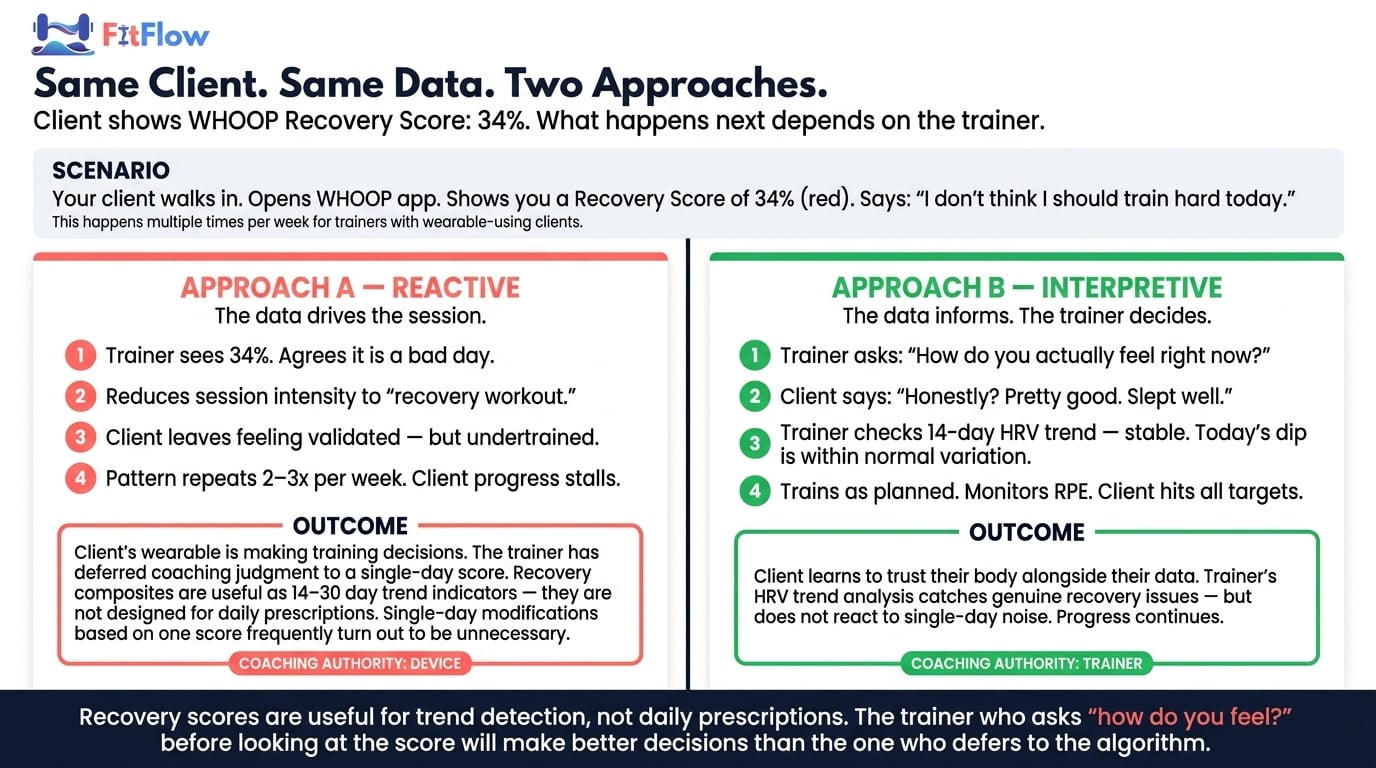
The WHOOP Algorithm Reset — What It Means for Trainers Using Recovery Scores
In February 2026, WHOOP deployed what the company described as a "comprehensive revision" of its heart rate algorithm. Independent analysis from the5krunner.com characterized it as "core algorithmic rework, model re-architecture and retraining." The update specifically targeted motion noise contamination, spurious heart rate spikes, and inaccurate peak heart rate detection during high-intensity activities.
These are not minor calibration adjustments. This is an implicit acknowledgment that the heart rate data feeding WHOOP's Recovery, Strain, Sleep, and WHOOP Age calculations contained systematic errors — and that every downstream metric built on that heart rate foundation was affected.
For trainers who have been modulating client training intensity based on WHOOP recovery scores — prescribing lighter sessions when recovery was low, pushing harder when it was high — the implication is uncomfortable: those historical coaching decisions were based on data less reliable than either trainer or client assumed. Post-update WHOOP data appears meaningfully more reliable than pre-update data, but the lesson extends beyond WHOOP. Every consumer wearable uses proprietary algorithms that are periodically revised, recalibrated, or replaced. This is the same kind of structural reliability problem that surfaces in why fitness apps fail — the technology layer beneath the user experience is less stable than the user realizes.
The practical rule: use recovery scores for trend detection across 14-30 day windows. Never use a single day's recovery score to override your coaching judgment about whether a client should train.
Orthosomnia and Metric Anxiety — When the Data Hurts Your Clients
Not all wearable data problems are accuracy problems. Some are psychological. And the psychological impact may be more damaging to your clients than the accuracy gaps.
Orthosomnia — a clinically recognized condition first described by researchers at Rush University Medical Center in 2017 (PMC, 2017) — occurs when the pursuit of perfect sleep-tracker metrics actually worsens sleep quality. The patient becomes so anxious about achieving an optimal sleep score that the anxiety itself disrupts sleep.
This is not a fringe phenomenon. A 2024 cross-sectional study published in PMC found that 35.8% of sleep tracker users exhibited orthosomnia-related behaviors (PMC, 2024, n=176). More than one in three sleep tracker users may be sleeping worse because they are tracking sleep. The study found orthosomnia correlates with perfectionism, obsessive-compulsive traits, health anxiety, and narcissistic personality features.
Psychology Today covered the phenomenon in March 2026, noting that "the anxiety of not sleeping well, as indicated by a tracker, can itself cause sleeplessness." Time Magazine observed that "your quest for perfect sleep is keeping you awake."

For personal trainers, orthosomnia and broader metric anxiety represent a coaching problem that no firmware update will solve. You see your clients 2-5 times per week. You are often the first professional to notice when data obsession is degrading performance rather than improving it.
Signs to watch for in your clients:
Client cites a "bad sleep score" or "low recovery score" to cancel or modify a scheduled session
Client adjusts effort mid-workout based on a wearable recovery metric rather than perceived exertion
Client reports anxiety about data trends — particularly when the data conflicts with how they actually feel
Client checks device compulsively between sets or during rest periods
When you recognize these patterns, the coaching response is not to dismiss the data or confiscate the device. It is to reframe the relationship between the client and the data. The coaching script: "Your sleep score is one data point. How do you actually feel? Let us train to how your body responds today, not to a number." This is not anti-technology. It is pro-client — intervening when the tool starts causing recovery barriers most trainers miss.
The Trainer's Wearable Data Interpretation Framework
The preceding sections establish what the research shows. The question for your practice is: what do you actually do with this information? The answer is a three-tier trust hierarchy and a four-step integration process.
The Signal-to-Noise Framework: Three Tiers
Tier | Metrics | How to Use | How NOT to Use |
|---|---|---|---|
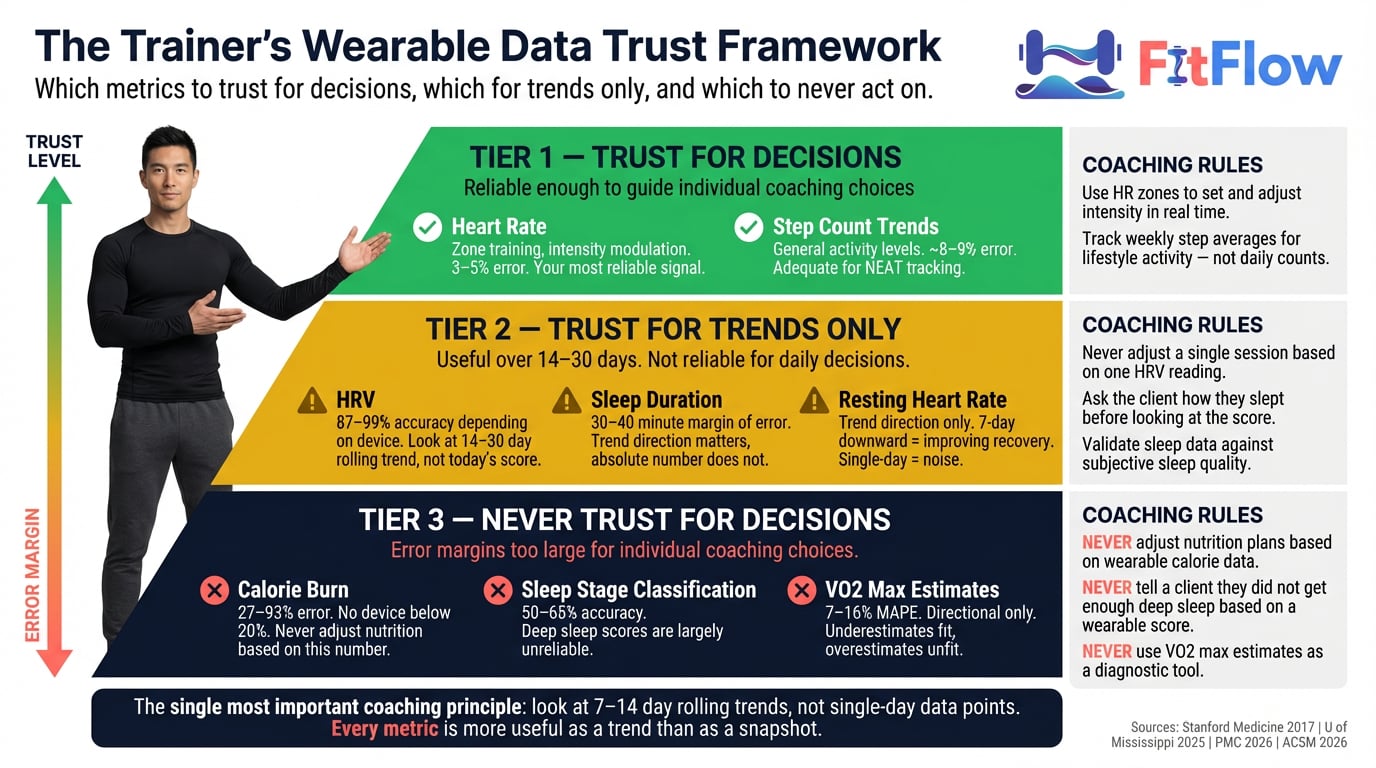
Tier 1 — Actionable | Heart rate, step count trends | Use HR for zone training and intensity modulation; track step trends for general activity levels | React to single-day step targets as if they were prescriptions |
Tier 2 — Contextual | HRV (14–30 day trends), sleep duration, resting heart rate trends, recovery scores | Track rolling averages over 2–4 weeks; cross-reference against subjective feedback | Use a single-day score to override coaching judgment |
Tier 3 — Noise | Single-day calorie burns, sleep stage classification, VO2 max estimates | Motivational reference only; never for programming or nutrition decisions | "Eat back" exercise calories; tell a client they did not get enough deep sleep based on a wearable score |
The Four-Step Integration: Collect, Filter, Contextualize, Decide
Step 1 — Collect. Gather wearable data from the client's device ecosystem. Know which device they use and which firmware version it runs.
Step 2 — Filter. Apply the three-tier framework. Separate Tier 1 actionable signals from Tier 2 contextual data and Tier 3 noise. In practice, most of the data clients present sits in Tier 2 or Tier 3.
Step 3 — Contextualize. Cross-reference filtered data against subjective client feedback. A low HRV trend is a different signal when the client also reports poor sleep and high work stress than when the client feels strong and rested. The Gatorade Sports Science Institute's framework for wearable data interpretation emphasizes that "wearable data without context is just numbers" (GSSI, "Making Sense of Wearables Data"). Your contextual knowledge of the client is the layer that transforms data into insight.
Step 4 — Decide. Make the coaching decision based on the contextualized signal, not the raw data. If Tier 1 trends and subjective feedback align (both indicate recovery deficit), adjust. If they conflict, lean toward the subjective experience and investigate.
The Coaching Conversation Protocol
When a client arrives and says, "My WHOOP says I should rest today," use this framework:
Acknowledge. "I see that. Let us look at the context."
Expand the data. "What has your recovery trend looked like over the last two weeks — not just today?" (Moves from Tier 3 to Tier 2.)
Add subjective data. "How do you actually feel right now? How did you sleep — not what the app says, but how you felt when you woke up?"
Coach the decision. "Based on your two-week trend, your subjective energy, and what I see in your movement quality, here is what I recommend and why."

This protocol validates the client's engagement with their data, moves the conversation from noise to signal, and reasserts your professional judgment as the decision layer above the data. The ACSM's 2026 position is clear: "Exercise professionals must stay informed about differences in device accuracy" and maintain the contextual judgment that devices cannot provide. A 2026 PMC review of wearable biosensing described the ideal as "human-AI collaboration" — where the technology provides data and the human professional provides interpretation (PMC, 2026).
Scaling This for 50+ Clients
For trainers managing large client rosters, reviewing individual wearable data daily is not sustainable. The practical approach:
Flag, do not review. Set up coaching platform dashboards (TrueCoach, Trainerize, or similar) to surface only significant deviations — resting heart rate changes greater than 10% over 7 days, HRV trend drops exceeding 15% over 14 days.
Build wearable data review into monthly check-ins, not daily communication. The monthly cadence matches the 14-30 day trend window that makes wearable data most useful.
Identify clients showing metric anxiety early. Clients who frequently cite device scores to modify planned sessions need a proactive conversation about the data-coaching relationship.
For guidance on choosing the right coaching platform for wearable integration, the platform decision directly affects how efficiently you can implement this framework at scale.
What to Tell Your Clients Today — And Your Three Actions This Week
The evidence is clear. Wearable data is not uniformly reliable, not uniformly unreliable, and not something trainers can afford to ignore. The coaching challenge is not whether to use wearable data — your clients are already using it. The challenge is becoming the interpreter they need.
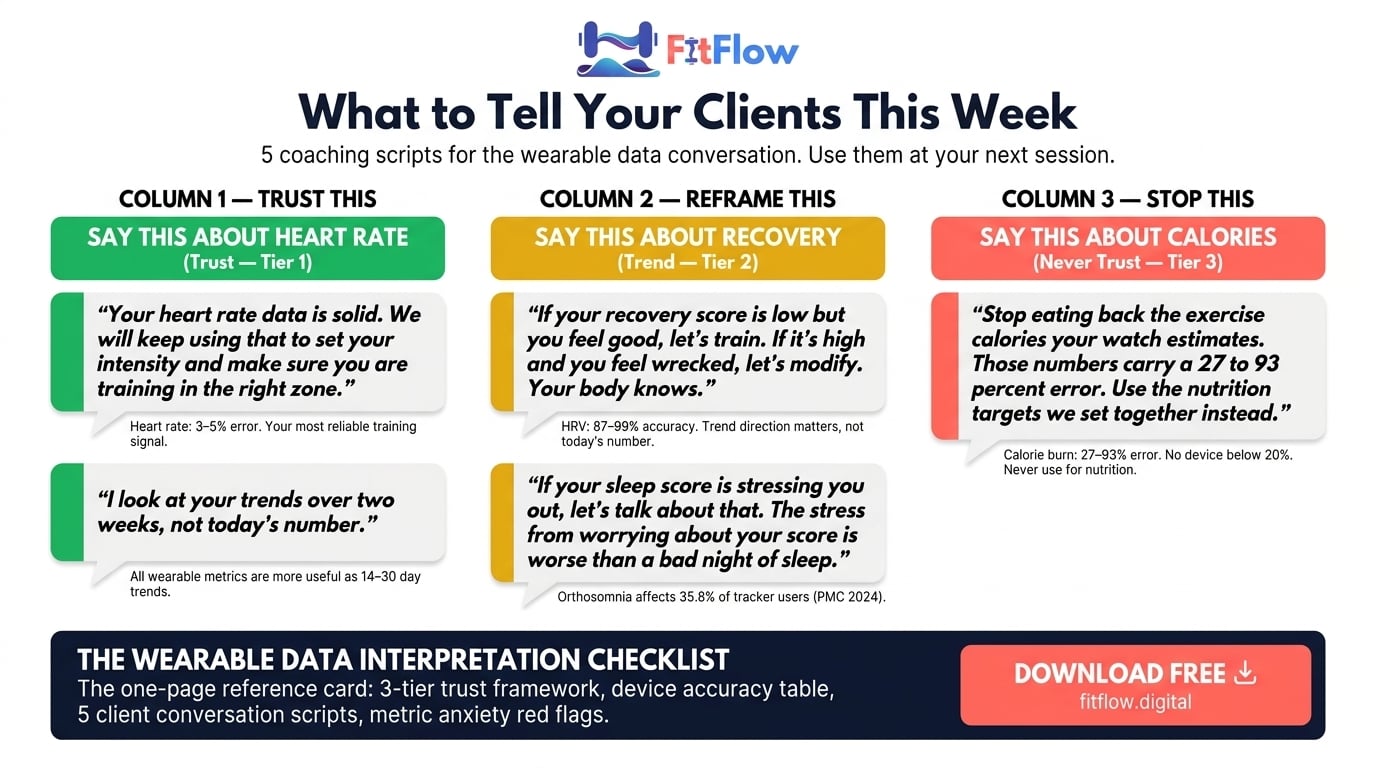
Five things to say to your clients this week:
"Your heart rate data is solid — we will keep using that for intensity." Validate what works. Heart rate accuracy is 95-97% across most devices.
"Stop eating back exercise calories your watch estimates. Use the nutrition targets we set together instead." The calorie data carries 27-93% error.
"If your recovery score is low but you feel good, let us train. If it is high and you feel wrecked, let us modify. Your body knows." Recovery scores are trend tools, not daily prescriptions.
"I look at your trends over two weeks, not today's number." This single reframe — from daily snapshot to trend analysis — transforms how clients relate to their data.
"If your sleep score is stressing you out, let us talk about that — the stress is worse than a bad night." More than 35% of sleep tracker users exhibit orthosomnia behaviors.
Use This Checklist at Your Next Client Session. Download the Checklist Now.
Your Three Actions This Week
You have read the data. You have the framework. Now do three things before you forget.
Action 1: Audit your client roster for wearable use (Day 1). Send a one-question check-in to every active client: "What wearable device are you currently using, if any?" You cannot interpret data you do not understand, and you cannot understand data without knowing its source and error margin.
Action 2: Apply the three-tier filter to your next five sessions (Days 2-4). For every client who references wearable data, mentally classify it: Tier 1 (actionable), Tier 2 (contextual), or Tier 3 (noise). Practice the coaching conversation protocol. Notice how often clients bring you Tier 3 data expecting Tier 1 decisions.
Action 3: Have the calorie conversation with one client who is tracking nutrition (Day 5). Choose one client who is actively using wearable calorie data to influence their eating. Have the direct conversation: "Your watch is excellent at telling us how hard your heart worked. It is terrible at telling us how many calories you burned. Let us build your nutrition plan on something more reliable." That one conversation may be the most impactful coaching intervention you deliver this month.
The trainers who thrive in the wearable era are not the ones who ignore the data or blindly follow it. They are the ones who become the interpreter — the human layer that turns noisy signals into coaching decisions. That is a service no device can provide. And it is a service your clients are already willing to pay for, if you can articulate what you know that their watch does not.
Frequently Asked Questions
Comments